Archive for December, 2012

This year has been the busiest year since the inception of Chandoo.org. We had 161 posts, 8,900+ comments, 33,500+ forum posts. We have trained more than 2,500 students thru training programs like Excel School & VBA Classes this year alone. More than 6.5 million people visited our site this year (up 82%), consuming a whopping […]
Continue »2012 has been the most awesome year since we started Chandoo.org.
The credit for this goes to our community of Excel users – that is you.
For practically every day of 2012, you have inspired me (and all of us at Chandoo.org) to learn something new, share and make you awesome. I know I say this many times, but I can never feel enough – Thank you for your support to Chandoo.org.
Apart from you, there are many other amazing people & companies that played a role in our success. In this post, let me highlight them & express my sincere gratitude.
Continue »![2013 Calendar – Excel Template [Downloads]](https://img.chandoo.org/c/2013-calendar-template-FREE-download.png)
Here is a New year gift to all our readers – free 2013 Excel Calendar Template.
This calender has,
- One page full calendar with notes, in 4 different color schemes
- Daily event planner & tracker
- 1 Mini calendar
- Monthly calendar (prints to 12 pages)
- Works for any year, just change year in Full tab.

We wish you a merry Christmas & very happy New Year 2013. May your holidays be filled with joy and warmth. And your new year with lots of hope, fun, strength and awesomeness.
I also want to tell you how thankful & fortunate I feel to have your support in this year. Your desire to learn Excel & become awesome at your work motivates me everyday to learn & share. 2012 is a memorable year because of you. Thank you.
Continue »{ 33 Comments }
Monitoring Monthly Service Levels using Excel Charts [Example]
Published on Dec 20, 2012 in Charts and Graphs
![Monitoring Monthly Service Levels using Excel Charts [Example]](https://img.chandoo.org/c/service-levels-7-years-excel-chart.png)
Recently, I wrote a tutorial on tax burden in USA chart.
Jared, One of our readers liked this chart very much. Jared works as a workforce scheduler and has data similar to our chart. So he applied the same technique to analyze monthly service levels for last 7 years & sent me the file so that I can share it with all of you.
First take a look at the demo of Jared’s chart. And read on to know how this works.
Continue »
Rama, one of our readers emailed this:
I Have Many List boxes In That I need to Hide Few Of them Using Check box
Show Hide list boxes by using a check box
We can use check box and a bit of VBA to do this easily. Something like above demo.
Read on to learn how to do this using Excel & VBA.
Continue »{ 240 Comments }
Can you find that pattern? [Homework]
Published on Dec 14, 2012 in Excel Challenges
![Can you find that pattern? [Homework]](https://img.chandoo.org/hw/can-you-find-that-pattern-excel-homework.png)
Are you ready for an Excel challenge?
Today, your job is very simple. Just find a pattern in a text and return corresponding value.
Your Homework:
In a range we have some resource types & their billing rates.
In another range, we have some descriptions. Each description contains a resource type somewhere inside it. We need to retrieve billing rate for each description by looking up which resource type is mentioned in it.
See above diagram.
Continue »{ 12 Comments }
Highlight best week & month in a trend chart [tutorials]
Published on Dec 12, 2012 in Charts and Graphs
![Highlight best week & month in a trend chart [tutorials]](https://img.chandoo.org/c/highlight-best-week-month-in-trend-charts-excel-howtos.png)
When analyzing business data like sales, shop visits or productivity, one of the questions managers always ask is,
What is the best month / week for this data?
To answer this question, we need to make a chart that looks like above. Today, lets learn how to highlight portions of such charts that correspond to best week or best month.
Continue »{ 2 Comments }
Dressing Financial Statements – What Motivated Mr. Bean to Defraud Latte?
Published on Dec 11, 2012 in Financial Modeling
Did you know What Happened at Last Coffee Day?
Mr. Bean “dressed up” the financial statements and was caught in the fraud. But he was the CEO of Latte! So why did he commit fraud in his own company??
Any Guess?
Take a cappuccino and I will give you a hint – How was Mr. Bean’s Bonus to be decided?
Read on to know more…
Continue »{ 38 Comments }
How the tax burden has changed over the years – Excellent chart by NYTimes & Redoing it in Excel
Published on Dec 6, 2012 in Charts and Graphs
If I need some charting inspiration, I always visit New York Times. Their interactive visualizations are some of the best you can find anywhere. Clear, beautifully crafted and powerful. Long time readers of Chandoo.org knew that I like to learn from visualizations in NY Times & redo them using Excel.
Today let me present you one such chart. This is based on an interactive visualization prepared by NY Times explaining how the tax burden has changed over years for various income groups.
Take a look at tax burden chart – Excel implementation
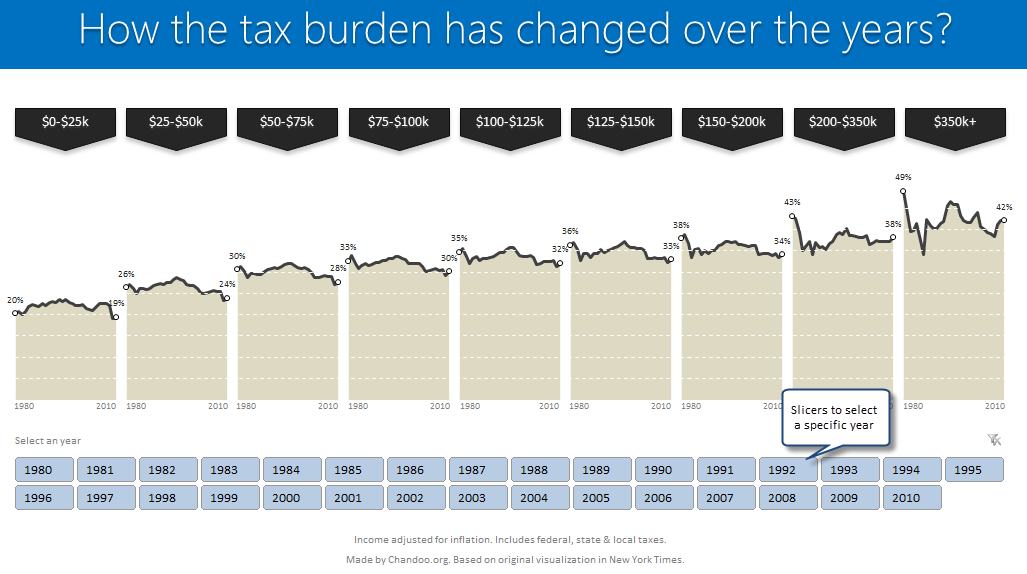
Read on to learn how to create this chart using Excel.
Continue »{ 19 Comments }
Formula Forensics No. 032 – Creating Dynamic Charts with Non-Contiguous Data
Published on Dec 4, 2012 in Formula Forensics, Posts by Sajan

There are many web pages devoted to Excel Charts and there are many web pages devoted to Creating Dynamic Ranges, but a lot of these suffer when the data is poorly organised or non-contiguous.
Today we look at a Technique for Creating Dynamic Charts with Non-Contiguous Data.
Continue »Hi Folks,
The moment you are waiting for is here. Our 2012 Holiday SALE is now on.
If you are ready, Just visit Holiday SALE page.
To know more read on…,
What is on sale?
Two of our most popular, awesome & valuable courses are on sale.
- Excel School & Dashboards program – Save $30
- Excel School, VBA & Dashboards program – Save $50
Our customers from India save Rs 1,200 & Rs 2,000 respectively.
Continue »
