Archive for November, 2011

.

.

.

.

.

.

.
This is the Forth post in Chandoo’s, Formula Forensics series.
Last week Luke showed us how to extract a sorted list according to a criteria from a larger list
and he analysed a formula to solve this problem
This week we look at Fred’s Problem…
How do I simplify a very long formula?
Continue »Maintenance Work Complete

Maintenance on the 18 month old, Data Tables, Monte-Carlo Simulations and Fractals in Excel – A Comprehensive Guide has been completed.
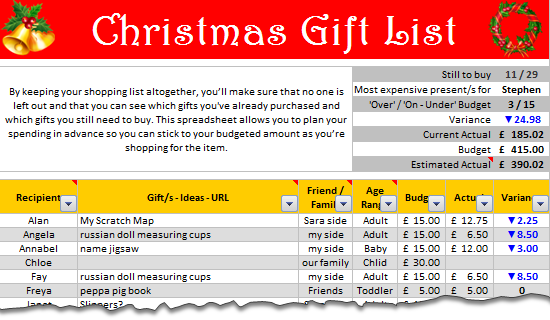
Continue »Christmas Gift Shopping List Template – Set budget, track your gifts using Excel

Last year, Steven shared a beautiful Christmas Gift List template with all of us. It is packed with lots of Excel goodness. Just a few days ago, he emailed me another copy of his file with some improvements. So if you are planning for Christmas shopping and want a handy tracker, you don’t want to miss this.
Continue »Add Data to Charts with Copy Paste [Quick Tip]
![Add Data to Charts with Copy Paste [Quick Tip]](https://img.chandoo.org/q/add-data-to-charts-with-copy-paste.png)
So how did your weekend go?
I did a bit of gardening, painted our car shed, played badminton (I am learning), attended 60th birthday of a close friend’s dad. Pretty hectic, but fun as usual.
To start this week, let me share a simple but fun way to add data to charts.
Lets say you have a chart that depicts Annual sales for last few years. And you want to add the data of Profits (or Expenses) to this chart. Here is a dead-simple way to do it.
- Copy the profit data by selecting it and pressing CTRL+C
- Select the chart
- Paste by pressing CTRL+V
- That is all!

Today we publish what is hopefully the First of many posts by guest author Luke M. it is also the Third post in the Formula Forensics series, which has now moved to a regular and new Thursday slot ?
Luke has taken up Hui’s and 3G’s challenge of explaining how the technique he regularly uses on the Chandoo.org Forums for extracting individual records out of a group.
Today Luke tells us how to extract a list of items from a larger list according to some criteria.
Continue »Making Small Multiples in Excel [Charting Technique]
![Making Small Multiples in Excel [Charting Technique]](https://img.chandoo.org/c/final-small-multiples-chart.png)
Today, lets learn how to create small-multiples (or panel charts) to visualize trend of 2 product lines over years in various regions. The inspiration for this chart and article came from my friend, Paresh‘s recent article on his blog.
See how you can create a combination of area & line chart to create the small-multiple chart and clone it. You can also download the workbook and play with it to understand this technique better.
Continue »Excel for Project Managers program is open, Please join today

My dear friends & readers of Chandoo.org,
We are so happy to announce Excel for Project Managers program for your consideration. Please read this short page to understand the benefits of this course & to sign-up. Or visit our sales page for details.
Who is this course for?
Well, I am sure you know the answer. This course is aimed at Project Managers, Business Analysts, Project Leads and people aiming for various project management roles. This course also helps project sponsors, people working in reporting & financial analysis of projects.
To enjoy this course, you should be familiar with various aspects of Excel (preferably Excel 2007 or 2010). This course is not aimed at absolute newbies of Excel.
Continue »Calculate Payment Schedule [Homework]
![Calculate Payment Schedule [Homework]](https://chandoo.org/img/hw/payment-schedule-formula-homework.png)
While I was away, Hui did a splendid job of starting a new series called Formula Forensics. The idea is to break down formulas for difficult real-world problems so that we can understand them better. In that spirit, I am giving you an interesting and tough formula homework. Situation: Imagine you work for Large Fries […]
Continue »Excel for Project Managers is coming up next Monday (14th), Details Inside…

Last week, we have announced about an upcoming online training program – Excel for Project Managers. Quite a few of expressed interest and shared ideas on how we should do this course. Finally, I am happy to announce the dates for this program and share details. Read on… Who is this program for? Well, there […]
Continue »
Formula Forensics # 002 – Joyces Question
This is the second post of a new regular weekly series at Chanoo.org, Formula Forensics, where we will examine how a formula works from the inside out with a worked example to help you understand its formation.
Last week we looked at Taruns problem and analysed a formula to solve his problem
This week we look at Joyce’s Problem…
Continue »Fancy Posts – using HTML Display Codes in Chandoo.org Posts
Normally when responding to a Post or a Forum Post you will see a plain old text response like

Occasionally you may see some Bold or Code highlighted like

How is this done and what else can I do to add value / pizazz to my posts ?
Continue »
This post examines a quick technique for developing Custom Number Formats for Cells, Charts or any other Number location in Excel.
Continue »

