Archive for January, 2009
Weekly Excel Links – Issues with Hosting of PHD
Over the weekend I got thinking about the various ways in which PHD can help you and I wonder if PHD should have forums. For one, forums are a great way to discuss ideas, find answers and develop community feeling. But at the same time, there are tons of very good excel forums that having another one may not really help. Currently I am leaning towards starting a forum to see how it goes. What do you think I should do ?
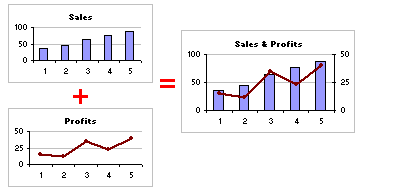
Continue »Excel Basics – What are Combination Charts and How to Make One?

A combination chart is when you combine two different charts to make one. A popular example for combination chart is a line & bar graph combination.
Continue »Featured Visualizations – Jan 02

Every week Pointy Haired Dilbert celebrates visualization and info-graphics by showcasing some of the creative and fun charting work from around the web. Have inspiration and fun. Browse hundreds of fun visualization and graphics projects in archives.
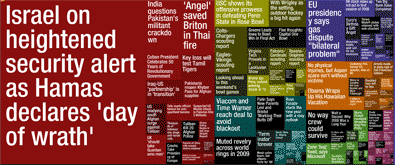
Newsmap is a creative and fun way to look at news. They organize news items on a tree map based on recency and relevancy of the news items (that are probably pulled from Google news). The background color indicates the news topic (red for world, purple for business, green for tech etc.)
Continue »
I have received 2009 Microsoft MVP Award.
The award is presented for Excel community contributions made in the past and includes a complimentary subscription to MSDN (and or Technet). It is a great feeling to know about this.
I am very thankful to this site and all the things I could learn and share through it. Special thanks to the anonymous MVP for nominating my name.
Continue »

