fbpx
Search
Close this search box.

All articles with 'combo box' Tag

CP005: Introduction to Form Controls – an interview with Debra Dalgleish

Published on Apr 17, 2014 in Chandoo.org Podcast Sessions, VBA Macros
CP005: Introduction to Form Controls – an interview with Debra Dalgleish

In the 5th session of Chandoo.org podcast, we are going to demystify form controls.

I am very happy and excited to interview my good friend, fellow Excel MVP, author, blogger and virtual mentor – Debra Dalgleish about this topic.

In this podcast, you will learn,

  • What are form controls
  • When you would use them?
  • Example form control – Combo box
  • How form controls differ from active-x controls
  • How to enable form controls in your Excel?
  • Various important form controls
  • Special bonus & how to obtain it
Continue »

How to create a Then vs. Now interactive chart in Excel?

Published on Aug 6, 2013 in Charts and Graphs
How to create a Then vs. Now interactive chart in Excel?

You have been there before.

Trying to compare last year numbers with this year, or last quarter with this quarter.

Today, let us learn how to create an interactive to chart to understand then vs. now.

Demo of Then vs. Now interactive chart

First, take a look the completed chart below. This is what you will be creating.

Continue »

Excel Links for you – Busy busy edition

Published on Jul 30, 2013 in excel links
Excel Links for you – Busy busy edition

As the launch date for our 2nd batch of Power Pivot class nears, my plate looks fuller than ever. Fine tuning the course details, preparing our online classroom for new batch of students and coordinating with Rob for video recording etc.

But I wanted to take a few mins today and share with you some really useful Excel tricks, ideas and examples from web. I found these really useful and inspiring. I am sure you will learn from these links as much as I learned.

Continue »

How to create an Interactive Chart in Excel? [Tutorial]

Published on Apr 23, 2013 in Charts and Graphs, Excel Howtos
How to create an Interactive Chart in Excel? [Tutorial]

Imagine you have a worksheet with lots of charts. And you want to make it look awesome & clean.

Solution?

Simple, create an interactive chart so that your users can pick one of many charts and see them.

Today let us understand how to create an interactive chart using Excel.

Continue »

Designing a dashboard to track Employee vacations [case study]

Published on Jan 24, 2013 in Charts and Graphs, Learn Excel
Designing a dashboard to track Employee vacations [case study]

Employee Vacation Dashboard & Tracker using Excel

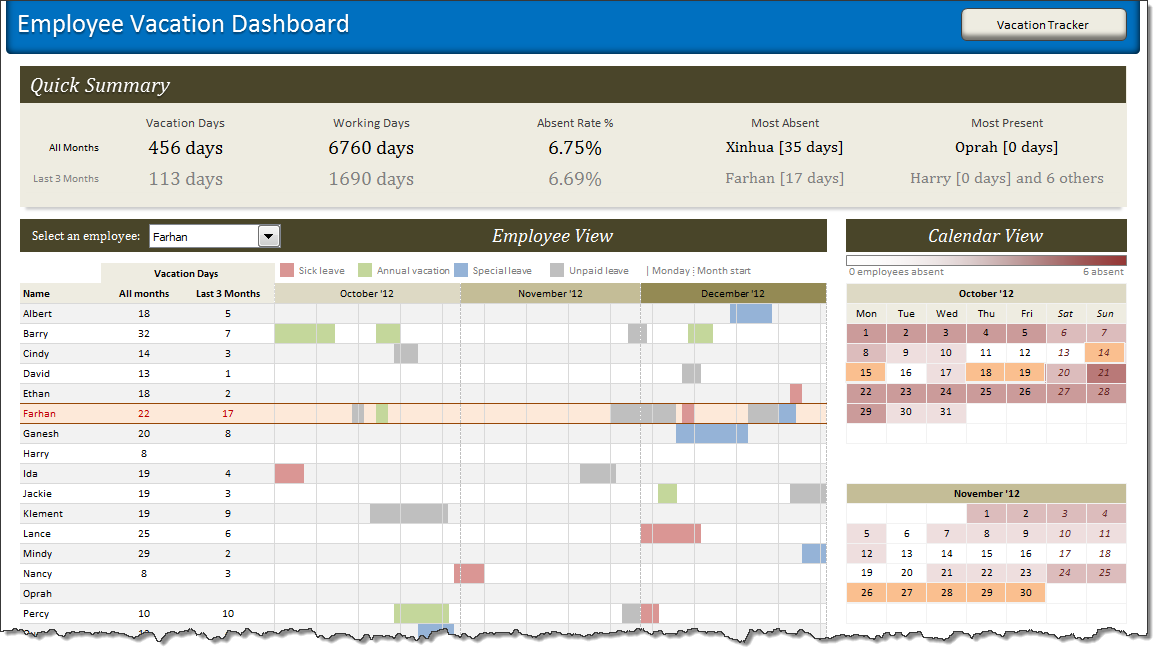
HR managers & department heads always ask, “So what is the vacation pattern of our employees? What is our average absent rate?”

Today lets tackle that question and learn how to create a dashboard to monitor employee vacations.

What do HR Managers need? (end user needs)

There are 2 aspects tracking vacations.

1. Data entry for vacations taken by employees
2. Status dashboard to summarize vacation data

Continue »

Using pivot tables to find out non performing customers

Published on Oct 3, 2012 in Excel Howtos, Pivot Tables & Charts, VBA Macros
Using pivot tables to find out non performing customers

Moosa, one of our readers emailed this interesting question:

I have huge list of customers (around 1500).
Table includes following information
Customer # , Customer Name, Sales 2002, sales 2003, … sales 2012

My requirements are
1. list of customer who did not have sales during all these years
2. List of customer who have not business from 2003
3. List of customer who have not business from 2004

Today, lets learn how to identify all the non-performing customers.

Continue »

Reporting Scenarios using Offset

Published on Feb 14, 2012 in Excel Howtos, Financial Modeling, Learn Excel
Reporting Scenarios using Offset

Project Managers often report financial numbers to the management. In a dynamic world, these numbers are usually based on a lot of factors that may or may not be under your control. So the top management demands that the numbers be reported as per different economic scenarios – Optimistic, Normal or Pessimistic. It is important […]

Continue »

Sales Analysis Charts in Excel – 78 Alternatives

Published on Jun 30, 2011 in Charts and Graphs, Excel Challenges, Learn Excel
Sales Analysis Charts in Excel – 78 Alternatives

Recently, I ran a contest asking you to analyze a bunch of sales data and present your results in charts. We received a total of 78 charts from 45 people. The contest entries had a mind-boggling variety of excel charts, techniques and ideas. It took me a while to go thru all the files and compile the results. Thanks for your patience. In this post, you can find all the charts along with my comments & links to download files.

Continue »

Excel Links – Updates on Singapore Workshop Edition

Published on Jun 27, 2011 in excel links

It has been a while since we had an Excel Links post. So here we are.

First, I want to update you about our Singapore Workshop.

As you know, we have opened the registrations for this workshop last week. If you are in Singapore and want to attend an Excel & Financial Modeling Workshop, Please consider joining us on July 8- 10. For details & enrollment, visit Singapore Bootcamp page.

Apart from the Singapore workshop, I was busy last week conducting live training at CapGemini, in their Hyderabad office on Excel & Dashboards. It was a very good experience. I learned a lot about practical challenges people face when doing sales reports etc. using Excel.

Continue »

Form Controls – Adding Interactivity to Your Worksheets

Published on Mar 30, 2011 in excel apps, Excel Howtos, Huis, Learn Excel, Posts by Hui
Form Controls – Adding Interactivity to Your Worksheets

Excel can be a bland collection of cells with text and numbers or it can be a playground where you can have interactive engagement with your models.

The choice is yours!

Excel provides a small number of tools to allow you to interact with your models.
These tools are called Form Controls and can be added into and linked to your models data.

This post will look at the various types of Form Controls and discuss their application and use.

Continue »

Dynamically Grouping Related Events [Excel Combo Charts with Pizzazz]

Published on Aug 27, 2009 in Charts and Graphs
Dynamically Grouping Related Events [Excel Combo Charts with Pizzazz]

Yesterday we have posted how to use excel combo charts to group related time events. Today we will learn how to change the event grouping dynamically using form controls.

This effect can be easily achieved with a cup of coffee, one combo box form control and the good old IF formula. Read more to learn how to do this.

Continue »