How well do you know your LOOKUPs? – Quiz Answers & Discussion
Last week, we had our very first quiz – “How well do you know your LOOKUPs?”. I hope you have enjoyed it.
Today lets understand the answers & explanations for this quiz.
10 things that wowed me in Excel 2013
As you may new, the newest version of Excel is out for a while. I have been using it since last 6 months and enjoying it. Today, lets understand 10 things in 2013 that wowed me (and probably you too).
Work with several Excel files everyday? – Save them as a workspace [Quick tip]
If you work with multiple Excel workbooks everyday, then here is a handy tip.
Use Save workspace feature to save your workbook collection & layout.
Designing a dashboard to track Employee vacations [case study]

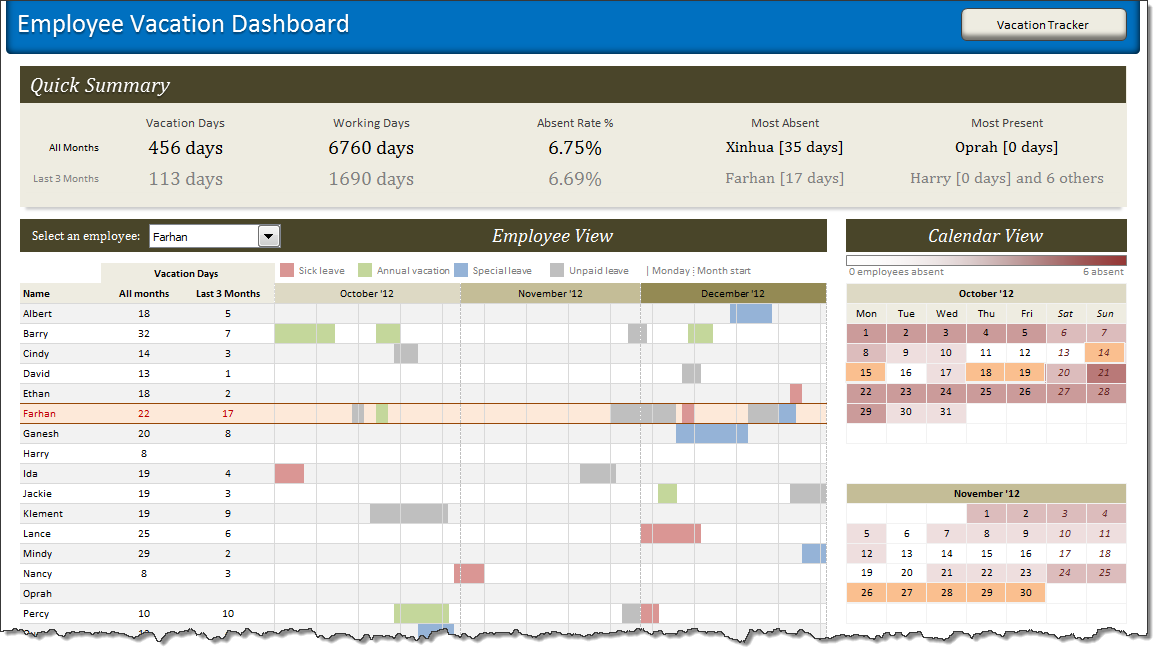
HR managers & department heads always ask, “So what is the vacation pattern of our employees? What is our average absent rate?”
Today lets tackle that question and learn how to create a dashboard to monitor employee vacations.
What do HR Managers need? (end user needs)
There are 2 aspects tracking vacations.
1. Data entry for vacations taken by employees
2. Status dashboard to summarize vacation data
What is Power Pivot – an Introduction [video]
Today, lets talk about Power Pivot & understand it.
What is Power Pivot?
Power Pivot is an Excel add-in to connect, analyze & visualize massive amounts of data..
Lets take a closer look at the definition.
Connect: You can use multiple tables of data & set up relationships between them using Power Pivot. For example, you can connect customer details to sales transactions so that you can summarize sales by customer location or gender easily.
Analyze: You can create simple pivot table style reports or create something exceedingly complex by defining your own calculated fields for values area of the pivot. There is a whole set of formulas defined for exactly this purpose, called as DAX formulas.
Visualize: Instantly filter your reports using slicers, time lines (Excel 2013 or above only), conditional formats, pivot charts etc. You can even define KPIs and see the performance in bands.
Massive Amounts of Data: Although your typical Excel worksheet contains a million rows, if you tried to load even half of those with any data, Excel would quickly become slow & lazy. Power Pivot can take a million rows for breakfast and would be hungry for more. It can processes millions of rows of data very quickly and easily, all from the comfort of a standard desktop or laptop.
Top 10 Formulas for Aspiring Analysts
Few weeks ago, someone asked me “What are the top 10 formulas?” That got me thinking.
While each of us have our own list of favorite, most frequently used formulas, there is no standard list of top 10 formulas for everyone. So, today let me attempt that.
If you want to become a data or business analyst then you must develop good understanding of Excel formulas & become fluent in them.
A good analyst should be familiar with below 10 formulas to begin with.
3 upcoming courses to Make you awesome [Announcements]
A quick announcement for all of you aiming to become awesome in Excel in 2013.
I am very happy to share our course timeline for first 3 months of 2013.
Upcoming Courses:
Here is a summary of courses I am planning to launch in next 3 months. I will be posting more details about these courses soon.
1. Finance for Non-finance people
Learn about financial basics, financial analysis thru Excel in our finance for non-finance people course. Designed by my partners at Pristine education, this course helps you gain insights to finance world quickly.
This course will be launched Thursday, January 10th – 2013
2. Power Pivot School
Jump in to power pivot, analyze data & extract insights like a pro by going thru this program. Aimed at Excel analysts & reporting professionals, this course helps you unleash power of PowerPivot to do awesome things.
This course will be launched on Wednesday, February 6th – 2013
…