All articles with 'VBA' Tag
Show pop-up calendar upon right click [Excel VBA]
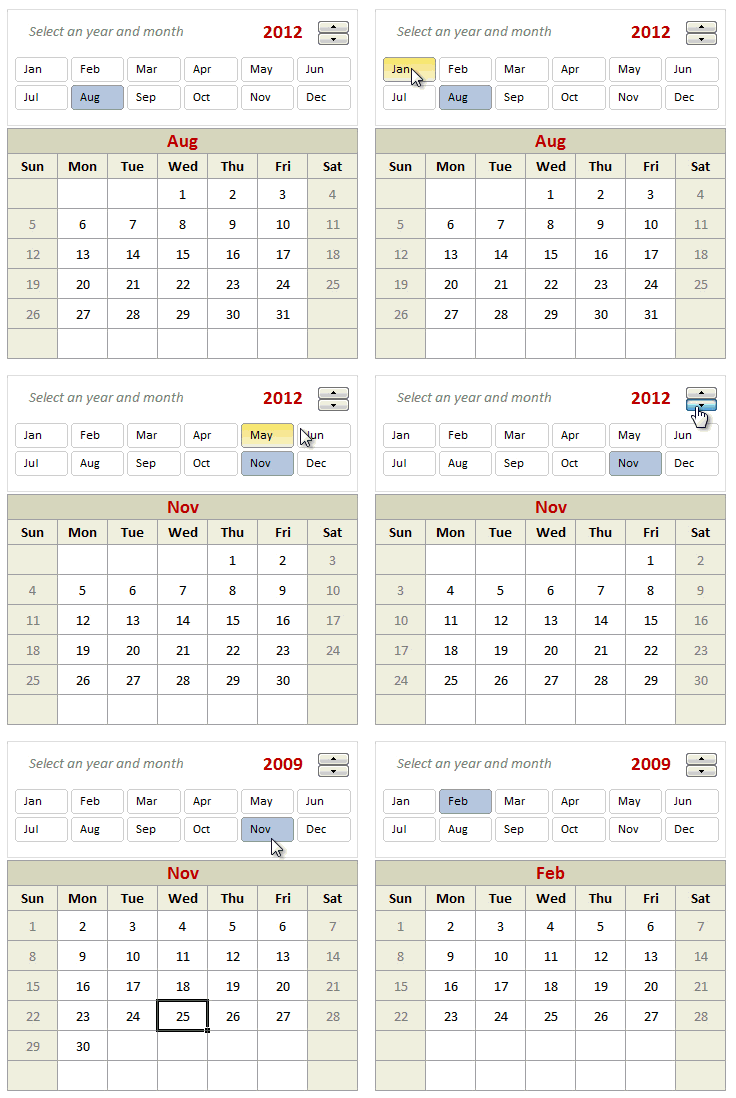
There are times when we are entering dates into several columns and would like to select a date from a popup calendar instead of manually typing.
Today, lets understand how we can set up a pop-up calendar in Excel so that your users can easily input dates by right clicking on a cell and inserting a date.

Using Arrays To Update Table Columns We are creating a lot of reports everyday and these reports contain a lot of data which is presented in various styles as per the requirements. The data that allows us to create the reports is usually referred as raw data and in most of the cases is stored […]
Continue »
We all have some projects to manage every now and then and there are needs of various trackers that help us in gauging the progress of the same. One of the most important things are heat maps that quickly help us in visually displaying the names of the projects that need special attention and resolve issues that are impacting them.
Continue »Hello there,
My travel to US was fantastic and fun. Many thanks to Jocelyn & Rob Collie, who found a nice apartment for us and made sure we are settled down in almost no time. Weather has been excellent so far too with lots of sunshine and blue skies. We went to a nearby park the other day and kids really loved walking on trials and exploring.
Gentle reminder
Today is last day to sign-up for my USA Masterclass
Today is last day to join my USA Advanced Excel & Dashboards masterclass with early bird discount. If you live near Chicago, Washington DC or Columbus and love Chandoo.org style of teaching, then you will benefit alot from my masterclass. We have very few spots left in Chicago & Columbus. So go ahead and book yours today and save $200.
Click here to know more and join us.
Continue »
Last week, we had a lovely poll on what are your favorite features of Excel? More than 120 people responded to it with various answers. So I did what any data analyst worth his salt would do,
I analyzed the data and here are the top 10 features in Excel according to you.
Read on to learn more.
Continue »![How to create interactive calendar to highlight events & appointments [Tutorial]](https://img.chandoo.org/vba/interactive-event-calendar-in-excel.png)
One of the popular uses of Excel is to maintain a list of events, appointments or other calendar related stuff. While Excel shines easily when you want to log this data, it has no quick way to visualize this information. But we can use little creativity, conditional formatting, few formulas & 3 lines of VBA code to create a slick, interactive calendar in Excel. Today, lets understand how to do this.
Continue »
Rama, one of our readers emailed this:
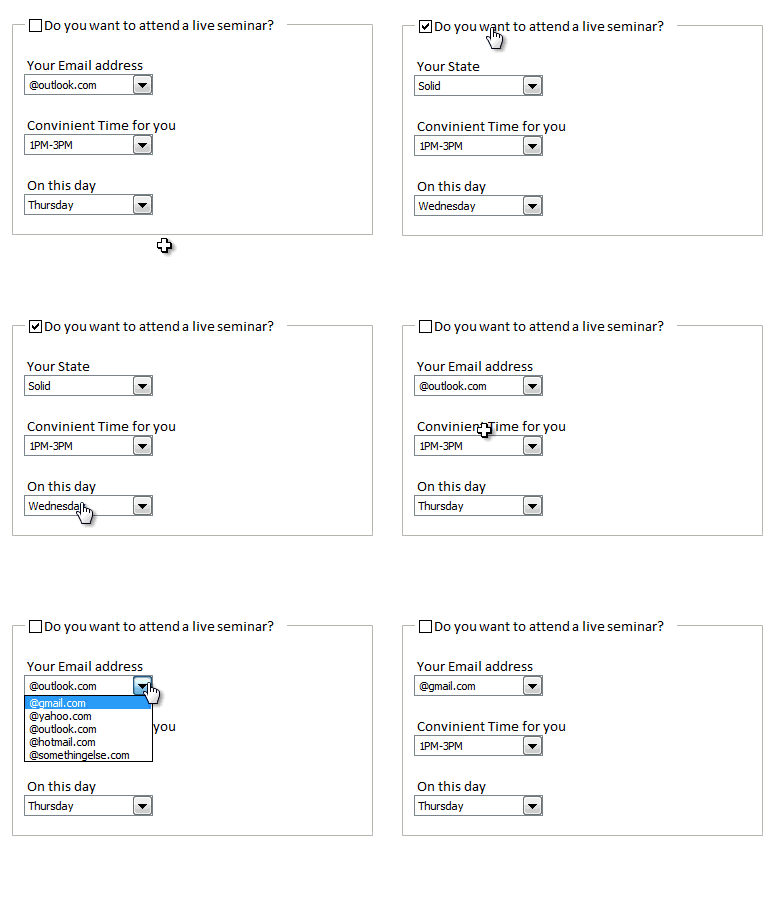
I Have Many List boxes In That I need to Hide Few Of them Using Check box
Show Hide list boxes by using a check box
We can use check box and a bit of VBA to do this easily. Something like above demo.
Read on to learn how to do this using Excel & VBA.
Continue »Macros for Automatically Implementing Modeling Best Practices

In the first part on our Modeling Best Practices series, we learned 5 best practices to follow. This article shows how to automatically implement the best practices using macros.
Continue »Extract data using Advanced Filter and VBA

In this post we will learn how to use the Advanced Filter option using VBA to allow us to filter our data on a separate sheet. This has been requested by a lot of our readers and here is how we will use them.
Continue »Excel Links – Lets meet in Chennai this Sunday edition
Hi readers… I am in Chennai this week, conducting in-house training at Renault Nissan on Advanced Excel. As I am busy teaching Excel & making young graduates awesome in it, I will not be able to write much on the blog. But don’t worry. We have some great articles coming up from Hui & other […]
Continue »![Project Portfolio Dashboard in Excel [Part 2 of 2]](https://img.chandoo.org/pm/project-portfolio-dashboard-small.png)
In this 2 part tutorial, we will learn how to design a project portfolio dashboard. Part 1 discussed user needs & design. Part 2 will show you Excel implementation.
Click here to get your copy.
Final Implementation – Project Portfolio Dashboard
First lets take a look at the finalized dashboard implementation. Continue reading to learn more & download this dashboard.
Continue »
Moosa, one of our readers emailed this interesting question:
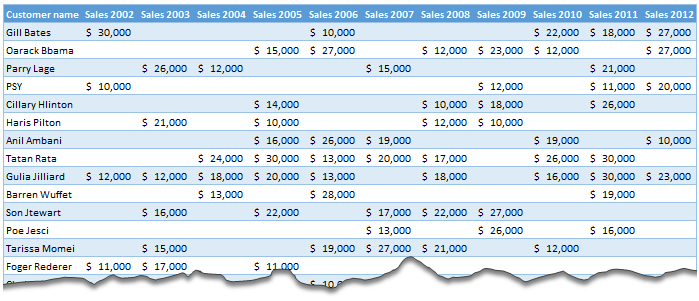
I have huge list of customers (around 1500).
Table includes following information
Customer # , Customer Name, Sales 2002, sales 2003, … sales 2012My requirements are
1. list of customer who did not have sales during all these years
2. List of customer who have not business from 2003
3. List of customer who have not business from 2004
Today, lets learn how to identify all the non-performing customers.
Continue »
Can we make a calendar using Pivot Tables?!? Of course we can. Today let us learn a simple technique to create calendar style reports using Pivot tables. Thanks to Rob for inspiration Before making any progress, let me thank Rob from PowerPivotPro for the inspiration. Recently he wrote an article explaining how to use PowerPivot […]
Continue »How fast can you finish this Excel Hurdles Challenge [Spreadsheet Olympics]
![How fast can you finish this Excel Hurdles Challenge [Spreadsheet Olympics]](https://img.chandoo.org/contests/excel-hurdles-challenge.png)
Watching the Olympic athletes run & jump all I could think of is,
- What should I eat to jump & sprint like that?
- How come I never heard about steeple chase?
- Should we really have 3 bullet points in all lists?
But I digress. Coming back, when watching one of those hurdles events, I got an idea as sharp as Chinese table tennis team.
Why not create a hurdles game in Excel to measure how good you are with keyboard?
So ladies & gentleman, let me present you our very own Olympics hurdle run.
Continue »![Making your dashboards interactive [Dashboard Essentials]](https://img.chandoo.org/vp/grammy-bump-chart-replication-in-excel-demo.gif)
Everyone likes to be in control. Even my 2 year old daughter jumps with joy when she lays her hands on TV remote. She pushes the buttons and assumes it is working. It is another story that we rarely watch TV at home.
By adding an element of control, we can make our dashboard reports fun. Interactive elements like form controls, slicers etc. invite users to play with your dashboard, get involved and understand data by asking questions. That is why I recommend making dashboards interactive.
Today lets understand how you can make dashboards interactive.
Continue »

