All articles with 'topx charts' Tag
{ 11 Comments }
Show Top 10 Values in Dashboards using Pivot Tables
Published on Dec 1, 2010 in Charts and Graphs, Pivot Tables & Charts
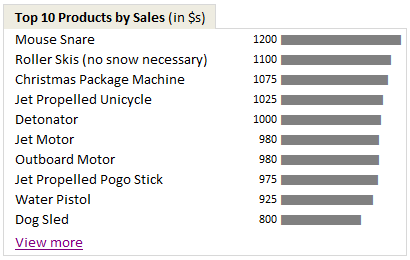
A good dashboard must show important information at a glance and provide option to drill down for details.
Showing Top 10 (or bottom 10) lists in a dashboard is a good way to achieve this (see aside). Today we will learn an interesting technique to do this in Excel.
Continue »{ 24 Comments }
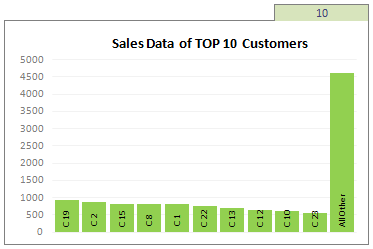
Top X chart – Show Top X values of a chart Interactively
Published on Nov 12, 2009 in Charts and Graphs, Learn Excel
Two charting principles we hear all the time are,
- Sort your data in a meaningful order before plotting it.
- Show only relevant information, not everything – because un-necessary information clutters the chart.
Today we will learn a dynamic charting technique that will mix these two ideas in a useful way. I call this a Top X chart.
Continue »
