All articles with 'tag cloud' Tag
{ 32 Comments }
Happy Birthday Hui, An Excel Dashboard to prove you are awesome!
Published on Jan 14, 2011 in Charts and Graphs, Cool Infographics & Data Visualizations

Some of you know our guest author and Excel ninja Hui. Yesterday was his birthday. And I wanted to create nice birthday gift for him. So I took a database dump of our forums data and created a dashboard.
Read rest of this post to see the dashboard & download workbook.
Continue »{ 24 Comments }
Excel Links – Next Dashboard Contest Edition
Published on Dec 13, 2010 in excel links

Almost an year ago, we had a memorable dashboard contest on Sales Dashboards. We got 32 beautiful, outstanding, well crafted entries and it was a lot of fun learning new tricks & meeting new members of our community. I am planning to have one more dashboard contest and I need your help.
I need you to suggest a topic for the contest (optional: and give some sample data)
Just drop a comment with your suggestions (and point to source data if any). We will have a dashboard contest on one of those topics.
Read the rest of this post to get some useful Excel related links.
Continue »{ 31 Comments }
An Excel Dashboard to Visualize 10,007 Comments [Dashboard Tutorial]
Published on Nov 24, 2010 in Charts and Graphs
![An Excel Dashboard to Visualize 10,007 Comments [Dashboard Tutorial]](https://chandoo.org/img/vp/10007-comments-dashboard-thumb.png)
First some good news, On 21st November, 2010, our little blog received its 10,000th comment!
Thank you so much for making this happen.
Those of you reading chandoo.org for a while know my penchant for comments. I have learned a lot of excel tips & ideas just by reading the comments you posted on this blog. I think comments are one of the best parts of this blog. So, naturally, I wanted to celebrate this milestone, with something big & awesome.
My intention was to download all the 10,000+ comments and play with the data to come up with something outstanding, like a dashboard. It took me 2 days to conceptualize and create this beauty.
Continue »{ 12 Comments }
Analyzing Search Keywords using Excel : Array Formulas in Real Life
Published on Apr 29, 2009 in Charts and Graphs, Learn Excel
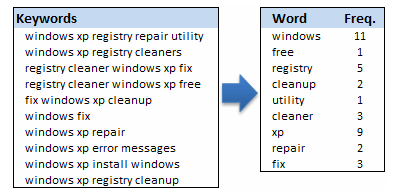
Jarad asks me in an email “how word frequency can be generated from a range of cells using excel formulas?” This got me thinking and lead to this post, where we learn how to calculate word frequency using array formulas and use it to analyze a bunch of search keywords.
Continue »
9 charting tricks you can use to make your pie charts likable
Continue »I was toying with the idea of creating a tag cloud in excel – as a form of new visualization, this could be useful when you have medium amounts of data (eg: 50-300 rows) and you want to emphasize on what is important and what is not. I would imagine using a tag-cloud, When you […]
Continue »
