All articles with 'screencasts' Tag
Add Data to Charts with Copy Paste [Quick Tip]
![Add Data to Charts with Copy Paste [Quick Tip]](https://img.chandoo.org/q/add-data-to-charts-with-copy-paste.png)
So how did your weekend go?
I did a bit of gardening, painted our car shed, played badminton (I am learning), attended 60th birthday of a close friend’s dad. Pretty hectic, but fun as usual.
To start this week, let me share a simple but fun way to add data to charts.
Lets say you have a chart that depicts Annual sales for last few years. And you want to add the data of Profits (or Expenses) to this chart. Here is a dead-simple way to do it.
- Copy the profit data by selecting it and pressing CTRL+C
- Select the chart
- Paste by pressing CTRL+V
- That is all!
Making Small Multiples in Excel [Charting Technique]
![Making Small Multiples in Excel [Charting Technique]](https://img.chandoo.org/c/final-small-multiples-chart.png)
Today, lets learn how to create small-multiples (or panel charts) to visualize trend of 2 product lines over years in various regions. The inspiration for this chart and article came from my friend, Paresh‘s recent article on his blog.
See how you can create a combination of area & line chart to create the small-multiple chart and clone it. You can also download the workbook and play with it to understand this technique better.
Continue »Analyzing Performance of Stocks using Excel [Example]
![Analyzing Performance of Stocks using Excel [Example]](https://chandoo.org/wp/wp-content/uploads/2011/09/stock-analysis-in-excel.png)
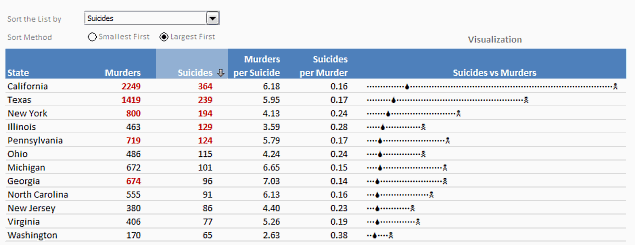
Last week, we learned how to visualize Suicides vs. Murders data using Interactive charts in Excel. William, one of our readers, took this technique and applied it to Stocks. He emailed me because he has some formula issues with the stock data. Once I solved the problem, I asked him, “Can I share this with […]
Continue »Suicides & Murders by US States – An Interactive Excel Chart

Over at PTS Blog, my dear friend & charting guru, Jon Peltier has an interesting post on using dot plots to visualize Murders & Suicides data by US States.
Not that murders & suicides fascinate me, but I wanted to play with this data myself and see how we can visualize it. So I emailed Jon and asked him to share the raw data. Being a lovely chap Jon is, he immediately sent me the data. So here we are, playing with gory data on a Friday.
Suicides & Murders by US States – An Interactive Excel Chart
You can see a demo of the chart I came up with above. Read on to learn how this chart is constructed.
Continue »My Top 10 Tips for Mastering VBA & Excel Macros [Part 5 of 5 – VBA Crash Course]
![My Top 10 Tips for Mastering VBA & Excel Macros [Part 5 of 5 – VBA Crash Course]](https://chandoo.org/img/vba/crash-course/top-10-tips-for-mastering-vba-excel-macros.png)
This article is part of our VBA Crash Course. Please read the rest of the articles in this series by clicking below links.
In the part 5 of our VBA Crash Course, let me share you my tips for mastering Excel VBA.
A warning before jumping in to the tips: I am not a VBA expert. I am a learner, just like you. I find VBA quite interesting language to learn and explore. These tips are based on what I have learned writing VBA (and VB code) in the last 12 years.
Continue »Understanding Variables, Conditions & Loops in VBA [Part 2 of 5]
![Understanding Variables, Conditions & Loops in VBA [Part 2 of 5]](https://img.chandoo.org/vba/crash-course/using-variables-loops-conditions-in-excel-vba-how-to.png)
In part 2 of our VBA Crash Course, we are going to learn what Variables, Conditions & Loops are and how to use them in Excel VBA.
What are Variables, Conditions & Loops?
If you are new to computer programming, you might think I am speaking legalese. So, to make it easy to understand, lets assume you run a bunch of stores across the town. To make it colorful, lets call your stores “We are nuts” – a dry fruit and nuts store chain. At the end of every day, you call each of the 24 store managers and ask them how much sales they have made in that day.
Now, you are not the kind of boss who micro-manages & nitpicks. So you don’t really note down sale for every store. Instead, as you call the store manager, you just mentally update the total. So first store says “$2,300” your total is 2300. Second manger says “$4,000”, the total now will be 6300. So on.
The value 6300 here is nothing but a variable.
We will use the “We are nuts” example thru out this lesson & towards the end we will build a sales logging application using Excel VBA.
Continue »What is VBA & Writing your First VBA Macro in Excel [VBA Crash Course Part 1 of 5]
![What is VBA & Writing your First VBA Macro in Excel [VBA Crash Course Part 1 of 5]](https://chandoo.org/img/vba/crash-course/excel-vba-crash-course.png)
This article is part of our VBA Crash Course. Please read the rest of the articles in this series by clicking below links.
- What is VBA & Writing your First VBA Macro in Excel
- Understanding Variables, Conditions & Loops in VBA
- Using Cells, Ranges & Other Objects in your Macros
- Putting it all together – Your First VBA Application using Excel
- My Top 10 Tips for Mastering VBA & Excel Macros
Split Text on New Line using Excel & VBA [Macros]
![Split Text on New Line using Excel & VBA [Macros]](https://chandoo.org/img/vba/split-text-on-new-line-macros-demo.gif)
Hafiz, One of our avid readers, writes in. My problem is when I convert data from text to column using dash “-“, conversion is easy. but when the gap provided in text is with “alt+enter”, I can’t convert the data.
Well, I tried to use text to columns feature (from Data ribbon) and it would not work.
Although you can use formulas to do the splitting, they might become tedious. So the next logical option is to use macros.
In this article, learn how to use VBA to split text on New Line characters
Continue »
Last week we learned how to create dynamic hyperlinks in Excel. Today, I want to show you something even cooler. An interactive dashboard based on hyperlinks, like shown above.
Isn’t it impressive?
Well, to create something like this, you don’t need a degree in advanced cryogenics. You just need a bunch of data, a chart, a one line macro code and some pixie dust (go easy on pixie dust).
Continue »NPV() function to calculate Present Value

Today, let us learn how to use NPV() function in Excel & create a simple financial model.
If you are dealing with cash and valuations, you are bound to have come across the NPV function. If you don’t know the assumptions behind the same, I bet it could cost you your job!
Let’s take a simple project – You buy a MSFT stock for USD 100. You receive a dividend of USD 10 in the first year, USD 20 in the second year, USD 40 in the third year and then you sell it out for USD 140. If you could have alternatively put this money in bank at 10% interest rate, have you gained anything?
How do you model this in excel? In this tutorial we understand how you can use NPV to do this analysis and what kind of pitfalls you can land into!!
Continue »Switch Scenarios Dynamically using Slicers

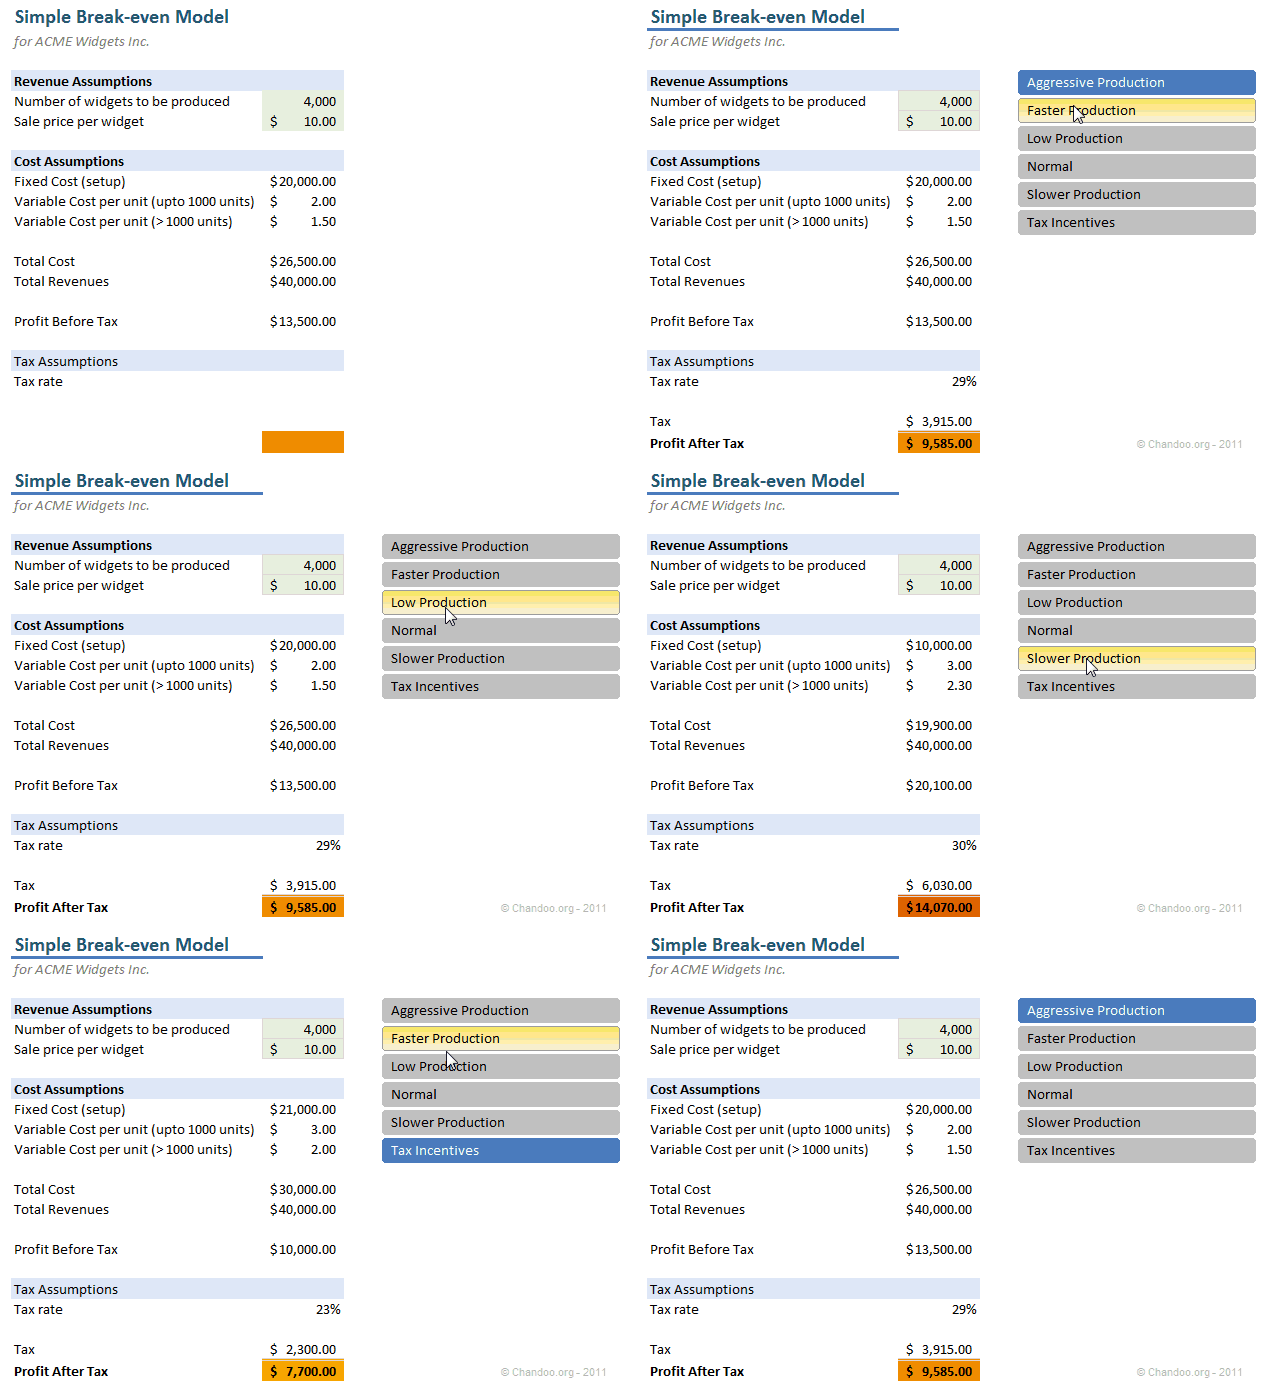
Slicers are my new favorite feature in Excel. Introduced in Excel 2010, Slicers are like visual filters.
Now, we can use slicers creatively to make an interactive scenario manager in Excel, as you can see below. We will learn how to create this in Excel in today’s post.
Continue »
How often have you had a simple table where you want to lookup a value or add up some values meeting a criteria?
This post looks at a simple way to do a 2D Lookup or 2D Sum of a values from within a 2D range with multiple criteria, without complex Sum, Offset, Index, Match, Sumifs or other functions, simply using Sumproduct
Continue »Mod() function in excel to Implement Escalation Frequency [Financial Modeling Tutorials]
![Mod() function in excel to Implement Escalation Frequency [Financial Modeling Tutorials]](https://chandoo.org/wp/wp-content/uploads/2011/04/EscalationFrequency.gif)
You take an apartment on rent at $1000 per month and the owner puts an escalation clause saying 10% increment each 3 years. How do you model this in excel? In this tutorial we understand how escalations at certain frequency can be implemented using the mod function in excel. What is the mod() function Simply […]
Continue »Use Copy & Paste to Preserve References to Tables [Quick Tip]
![Use Copy & Paste to Preserve References to Tables [Quick Tip]](https://chandoo.org/img/l/ed/structured-references-excel-tables.png)
With Excel 2007, Microsoft has introduced a powerful and useful feature called as Tables. One of the advantages of Tables is that you can write legible formulas by using structural references. That means, you can write easy to understand formulas like this,
But, there is a problem. When you write these formula and drag the formula cell sideways to fill remaining cells, Excel changes table column references and thus makes your formulas almost useless.
Well, there is a simple workaround for this problem
Continue »Count-down Timer App in VBA to Remind you about the VBAClasses Closing Time!!!
Here is a cool count-down timer application made in VBA to remind you about our VBAClasses registration closing time!
Read the rest of this post to learn how this particular app is built.
If you want to learn VBA, then click here to join our class.
Continue »


