All articles with 'problems' Tag
Are you a Solver Virgin? Watch this tutorial video …,
Do you ever think about questions like this?
1) What is the maximum profit we can make?
2) What is the best way to schedule employees in shifts?
3) What the best combination of tasks we can finish in a given time?
You might have heard about Excel Solver tool while trying to find solutions to questions above. If you have never used Solver or have little idea about it, then this post and video are for you.
Continue »How to present changes in Market Share using Charts?

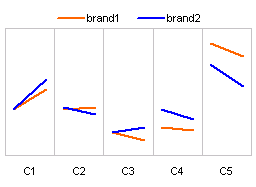
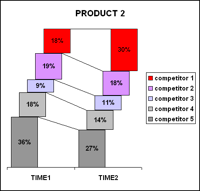
Most of us are comfortable with numbers, but we are confused when it comes to convert the numbers to charts. We struggle finding the right size, color and type of charts for our numbers. The challenge is two fold, we want to make the charts look good (we mean, really… really good) but at the […]
Continue »Visualization Challenge – How to show market share changes?

One of our readers Jennifer mailed me with this excel charting problem she is having. I thought why not ask other readers for their advice on this. So here it goes: The Charting Challenge – Visualizing Changes in Market Share Here is an excerpt from her email: The gist of my problem is how to […]
Continue »

