All articles with 'percentilerank()' Tag
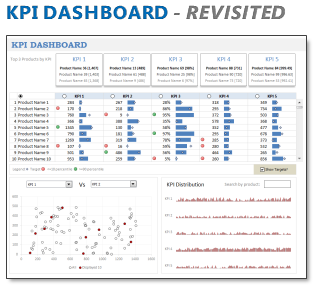
In 2008, I received an email from Robert Mundigl, which was the start of a life-long friendship. Robert asked me if he can teach us how to make KPI dashboards using Excel. I gladly said yes because I am always looking for new ways to use Excel.
The original KPI dashboards using Excel article was so popular. They still help around 12,000 people around the globe every month. Many of our regular readers and members have once started their journey on Chandoo.org from these articles.
In this article, we will revisit the dashboard and give it a fresh new spin using Excel 2007.
Continue »{ 11 Comments }
Excel Teens are out to get you & Other findings from our Survey
Published on Feb 25, 2011 in Charts and Graphs
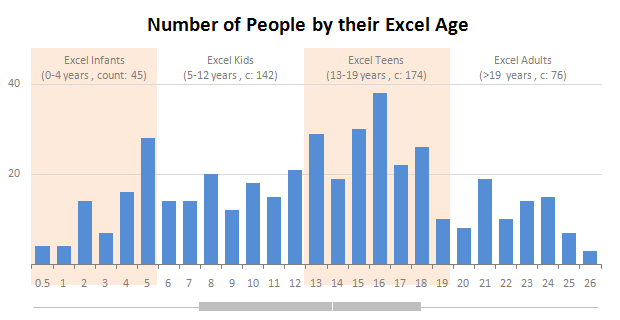
Our of curiosity and fun I asked you “how long have you been using Excel?”. I was overwhelmed by the response we got to this simple question. More than 437 people responded with their comments, stories and enthusiastic responses. Thank you so much.
It would taken me more time to make the charts and understand the data. But thanks to Hui, who volunteered to tabulate all the survey data in a simple CSV.
Shown above is a chart I came up with based on the data. Read the rest of the post to understand the survey results and view more charts. Also, you can download the excel workbooks and original data set to play.
Continue »
