All articles with 'moving average' Tag
6 Must Know Line Chart variations for Data Analysis

Line charts in Excel are essential for trend analysis, spotting distribution and outliers. Use these 6 variations to get more out your line chart.
- Indexed Line Chart
- Sparklines
- Spaghetti Line Chart
- Smoothed Line Chart
- Forecast Line Chart
- Line Chart Combinations
CP010: Averages are Mean – 8 Techniques for making your analysis above average

Podcast: Play in new window | Download
Subscribe: Apple Podcasts | Spotify | RSS
This is a continuation of Session 9 – Averages are mean
In the earlier episode, we talked about AVERAGE and why it should be avoided. In this session, learn about 8 power analysis techniques that will lift your work above averages.
In this podcast, you will learn,
- Re-cap – Why avoid averages
- 8 Techniques for better analysis
- #1: Start with AVERAGE
- #2: Moving Averages
- #3: Weighted Averages
- #4: Visualize the data
- …
- Conclusions

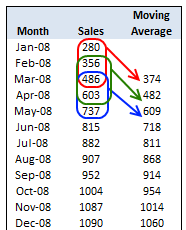
As part of our spreadcheats, today we will learn how to calculate moving average using excel formulas. As a bonus, you will also learn how to calculate moving average of latest 3 months alone using the count, average and offset formulas. Once you finish the tutorial, you have some home work to do as well. So go ahead and learn how to calculate moving averages.
Continue »

