All articles with 'funnel charts' Tag
{ 0 Comments }
Make a quick funnel chart in Excel to track sales performance [video]
Published on Aug 29, 2015 in Charts and Graphs, Learn Excel
![Make a quick funnel chart in Excel to track sales performance [video]](https://chandoo.org/wp/wp-content/uploads/2015/08/funnel-chart-excel.png)
Funnel charts are useful to visualize sales & marketing performance. In this brief video, let’s understand how to make a quick funnel chart in Excel.
Read on to learn how to make funnel charts & to download a template for your funnel analysis needs.
Continue »{ 41 Comments }
Yet Another Sales Funnel Chart in Excel
Published on Mar 5, 2012 in Charts and Graphs

A while ago, our reader Shay emailed me a Sales Funnel chart template.
I had to create a sales funnel for my company and I looked all over the internet to see how to do what I needed to do. I couldn’t find anything. I tried your funnel chart as well but because my numbers are all over the place I couldn’t get it to work for me.
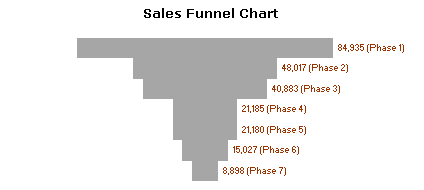
I get so much information from you that I decided to share this chart with you. I used the shapes drawings to create the funnel graphic and the camera tool to place the values in each shape. I used formulas in the original data so that I will not have to recalculate every month.
I took the liberty of making little changes to Shay‘s funnel chart template to make it even better. Here is how the funnel looks like.
Continue »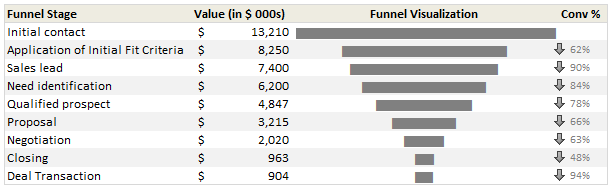
Sales Funnel or Sales Process refers to a systematic approach to selling a product or service. [more on sales process] Whether you run a small business or part of a large corporation, chances are, you heard about Sale Funnel. Understanding & analyzing your sales performance from a Funnel point of view is a great way […]
Continue »{ 25 Comments }
Sales Funnel Charts in Excel – Tutorial
Published on Jan 9, 2009 in Charts and Graphs, Learn Excel
Sales funnel is a very common business chart. Here is a simple bar chart based trick you can use to generate a good funnel chart to be included in that project report.
Continue »
