All articles with 'examples' Tag
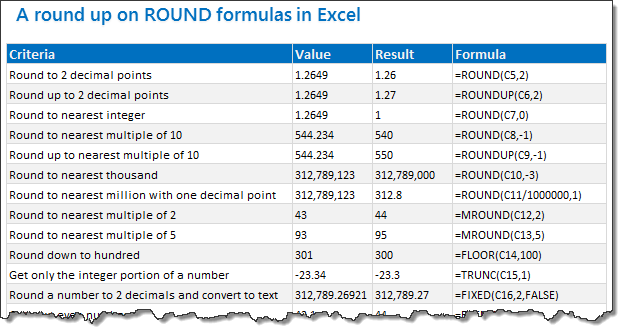
18.2 Tips on Rounding numbers using Excel Formulas

Lets talk round numbers today.I have 18.2 tips for you on round numbers.
We can use a variety of formulas to round numbers in Excel depending on the situation. We have ROUND, ROUNDUP, ROUNDDOWN, MROUND, INT, TRUNC, CEILING, FLOOR, FIXED, EVEN, ODD and few more. To know how to use all these formulas and how to round numbers based on any criteria, just read on.
Continue »![Making your dashboards interactive [Dashboard Essentials]](https://img.chandoo.org/vp/grammy-bump-chart-replication-in-excel-demo.gif)
Everyone likes to be in control. Even my 2 year old daughter jumps with joy when she lays her hands on TV remote. She pushes the buttons and assumes it is working. It is another story that we rarely watch TV at home.
By adding an element of control, we can make our dashboard reports fun. Interactive elements like form controls, slicers etc. invite users to play with your dashboard, get involved and understand data by asking questions. That is why I recommend making dashboards interactive.
Today lets understand how you can make dashboards interactive.
Continue »
Here is a little experiment to freak out excel.
Go to cell C3 and write =C3 and press Enter. Excel would throw up nasty message saying, “Microsoft did not know what to do. We have a sent a support engineer to your home, but he is stuck at the round-about near your house.”
Well, not really. But what you did when you wrote the formula =C3 in cell C3 was, you created a circular reference.
A circular reference is created when you refer to same cell either directly or indirectly.
See Mona Lisa, in circular reference style.
Learn more about Excel Circular References, how to use them, examples, how to avoid them, how to deal with them in this article.
Continue »Sales Dashboards – Visualizing Sales Data – 32 Dashboard Examples & Implementations

Sales reports and dashboards are very common in any company. There are several ways in which you can visualize sales data to understand the trends and sales performance. So in November, I have asked you to visualize sales data using sample data. The visualization challenge #2, sponsored by Zoho Reports generated a huge buzz around the community and fetched 32 incredible entries. The response was so overwhelming that it took me almost 24 hours to write this post. Thanks everyone for participating and making this a huge learning experience for everyone. Personally I have learned several useful dashboard and charting tricks. I will be sharing some of these lessons with all of you in the coming weeks.
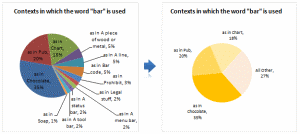
Continue »Group Smaller Slices in Pie Charts to Improve Readability

Jon Peltier can stand on his roof and shout in to a megaphone “Use Bar Charts, Not Pies”, but the fact remains that most of us use pie charts sometime or other. In fact I will go ahead and say that pie charts are actually the most widely used charts in business contexts.
Today I want to teach you a simple pie chart hack that can improve readability of the chart while retaining most of the critical information intact.
Continue »Dashboard Best Practice – Google Analytics Intelligence Report

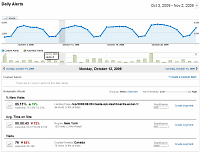
Yesterday while checking my website analytics reports on Google analytics site, I have noticed a new beta feature called “Intelligence”. Out of curiosity I clicked on it. It took me to a an intelligence alert dashboard. Ok, lets just back up for a minute and understand what “intelligence dashboard” is before moving on. In the […]
Continue »Project Dashboard + Tweetboard = pure awesomeness!!!

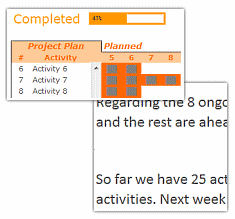
Check out an implementation of project dashboard along with tweetboard by our reader Fernando. He says, it “turned out to be a great success”. I am so happy for him.
Btw, the post includes a link to download the workbook so that you can see the dashboard and tweetboard in action.
Continue »
In this installment of spreadcheats, we will learn how to use goal seek feature of excel. We will build a retirement savings calculator using excel. We will learn to use Excel’s FV() formula to estimate the corpus that can be accumulated by saving fixed amount every month.
Continue »Sumif with multiple conditions [quick tip]
![Sumif with multiple conditions [quick tip]](https://chandoo.org/img/l/sumif-with-multiple-conditions.png)
Here is a little formula trick if you need to sum a range of cells based on multiple conditions.
Assuming you have the starfleet, captain and flight data, you can use the good old sum() in an array formula to conditionally sum values meeting multiple criteria. Read on to learn this quick tip.
Continue »Generating invoice numbers using excel [reader questions]
![Generating invoice numbers using excel [reader questions]](https://chandoo.org/img/l/invoice-numbers.gif)
Learn how to generate invoice numbers, tax codes etc. using Microsoft Excel. In this example we will take a real life example shared by Michelle and findout how we can generate invoice numbers using excel formulas. Read more to learn and download the example workbook.
Continue »
Often when you are writing code or testing an application, it might be helpful to have random phone numbers generated for you. Here is an excel formula that I use: =value(left(substitute(rand(),”0.”,””),10)) try these 2 instead (thanks to John) =RAND()*(9999999999-1000000000)+1000000000 =RANDBETWEEN(1000000000,9999999999) [needs analysis toolpack add-in or excel 2007] Even though it works most of the time […]
Continue »

