All articles with 'downloads' Tag
Clean up Incorrectly Formatted Phone Numbers using Excel

In our Utopian imaginations all the data would have been standardized and shareable across systems and people. But alas, the reality is totally different. We seldom get data in the format / way we desire it to be. In other words, the ingredients are all there, but for us to prepare the dinner, you must […]
Continue »
There are few charts in excel that are as revolting as a radar chart. The purpose of a radar chart is to compare m options across n parameters so that audience can be convinced that option A is better than say option B. But, I am yet to come across a radar chart that tells […]
Continue »![Excel KPI Dashboards – Adding Micro Charts [Part 4 of 6]](https://chandoo.org/wp/wp-content/uploads/2008/09/kpi-dashboard-excel-thumb.jpg)
This is 4th part of Creating Management Dashboards in Microsoft Excel 6 post series by Robert. This 6 Part Tutorial on Management Dashboards Teaches YOU: Creating a Scrollable List View in Dashboard Add Ability to Sort on Any KPI to the Dashboard Highlight KPIs Based on Percentile Add Microcharts to KPI Dashboards Compare 2 KPIs […]
Continue »![KPI Dashboards – Highlight KPIs Based on Percentile [Part 3 or 6]](https://chandoo.org/wp/wp-content/uploads/2008/09/kpi-dashboard-3-thumb.jpg)
Creating KPI Dashboards in Microsoft Excel is a series of 6 posts by Robert from Munich, Germany. This 6 Part Tutorial on KPI Dashboards Teaches YOU: Creating a Scrollable List View in Dashboard Add Ability to Sort on Any KPI to the Dashboard Highlight KPIs Based on Percentile Add Microcharts to KPI Dashboards Compare 2 […]
Continue »Excel Bullet Graphs

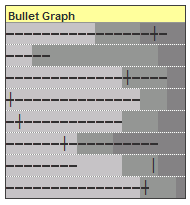
Bullet graphs provide an effective way to dashboard target vs. actual performance data, the bread and butter of corporate analytics. Howmuchever effective they are, the sad truth is there is no one easy way to do them in excel. I have prepared a short tutorial that can make you a dashboard ninja without writing extensive […]
Continue »Learn Excel IF Formula – 5 Tricks you Didnt know

Excel has various functions, including functions to calculate inverse cosine of a given value, to multiply 2 matrices, to estimate the internal rate of return. But, most of us(well, just me then..) use just about 5-6 formulas to do our jobs. And IF formulas are a majority of these, so it doesn’t harm to learn […]
Continue »73 Free Designer Quality Excel Chart Templates – Grab now and become a charting superman
How many times you created a chart in Microsoft excel and formatted it for minutes (and sometimes hours) to reduce the eye-sore? Well, I will tell you my answer, its 293049430493 times 😉 Worry not! for you can become a charting superman (or elastigirl) by using these 73 free designer quality chart templates in literally […]
Continue »How to: sharing trip expenses using excel
Yesterday we were calculating our Washington trip expenses and it occurred to me that if there is an excel template where I could enter the trip expenses and who paid what to find out how much we need to pay up / collect, it would be great. I looked around for few seconds, couldn’t find […]
Continue »

