All articles with 'downloads' Tag
{ 4 Comments }
Distinct Count & Blanks – Power Pivot Real Life Example
Published on Feb 11, 2013 in Power Pivot
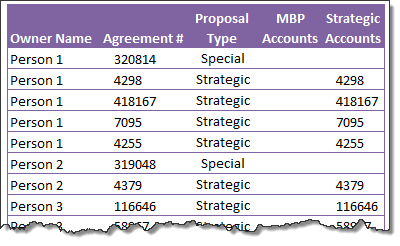
When it comes to analyzing business data, managers are always asking, “so how many distinct x each y is doing?”
And that sends us, data analysts & reporting professionals running from pillar to post figuring out the best way to do it.
- We can use variations of SUMPRODUCT, COUNTIFS etc, but the methods are not flexible..
- We can use VBA, but it would become slow as you add more data.
- We can use Pivot tables, but it only gives half of what we want ie each y part, but not distinct count of x.
- We might as well shave our head with a shovel before manually counting values.
And that brings us to 2 distinctly simple solutions:
- Using Power Pivot & Excel 2010
- Using regular pivot tables in Excel 2013
Today, lets talk about these 2 approaches & see why they are so better than anything else for distinct count situations.
Continue »{ 49 Comments }
Transpose a table of data using Excel Formulas
Published on Feb 1, 2013 in Excel Howtos
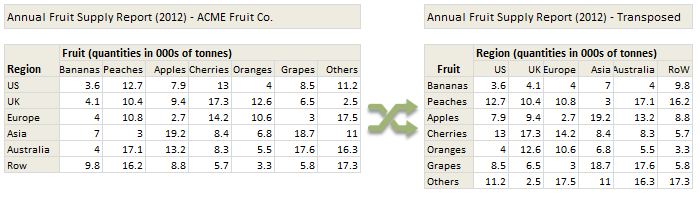
Today lets tackle a familiar data clean-up problem using Excel – Transposing data.
That is, we want to take all rows in our data & make them columns. Something like this:
Learn these 4 techniques to transpose data:
1. Using Paste Special > Transpose
2. Using INDEX formula & Helper cells
3. Using INDEX, ROWS & COLUMNS formulas
4. Using TRANSPOSE Formula
{ 4 Comments }
Details about our Power Pivot Course [and a video for those of you not interested]
Published on Jan 30, 2013 in Excel Howtos, Power Pivot
![Details about our Power Pivot Course [and a video for those of you not interested]](https://img.chandoo.org/power-pivot/power-pivot-course-details.png)
Hello folks,
If this article was a person, they would be schizophrenic. You see, it has 2 purposes:
- Give you all the details about my upcoming Power Pivot course
- Give you a solution to last week’s vacation days problem
Details about Power Pivot Course
Power Pivot, an Excel add-in makes it easy to connect, analyze & visualize massive amounts of data. This course aims to teach you how to use Power Pivot to analyze data, create advanced reports & prepare dashboards all from familiar interface of Excel. This is ideal for data analysts, reporting & MIS professionals, business analysts, managers & dashboard makers.
{ 67 Comments }
Can you calculate vacation days in a period? [Homework]
Published on Jan 25, 2013 in Excel Challenges
![Can you calculate vacation days in a period? [Homework]](https://img.chandoo.org/hw/calculate-vacation-days-excel-formula-homework.png)
Its Friday, that means time for another Excel challenge for you.
Calculate vacation days in a period:
Your mission, if you choose to accept it,
Step 1: Download the hom work problem file.
Step 2: Calculate number of vacations taken in a period. Specifically,
1) How many vacations are taken between start & end dates, assuming complete vacation should be inside the start & end date period?
2) How many vacations are taken such that at least one day of vacation is between start & end dates?
3) How many people took vacations? (if same person took multiple vacations, then count it as 1)
{ 132 Comments }
Designing a dashboard to track Employee vacations [case study]
Published on Jan 24, 2013 in Charts and Graphs, Learn Excel
![Designing a dashboard to track Employee vacations [case study]](https://chandoo.org/wp/wp-content/uploads/2013/01/employee-vacation-dashboard-full-view.png)
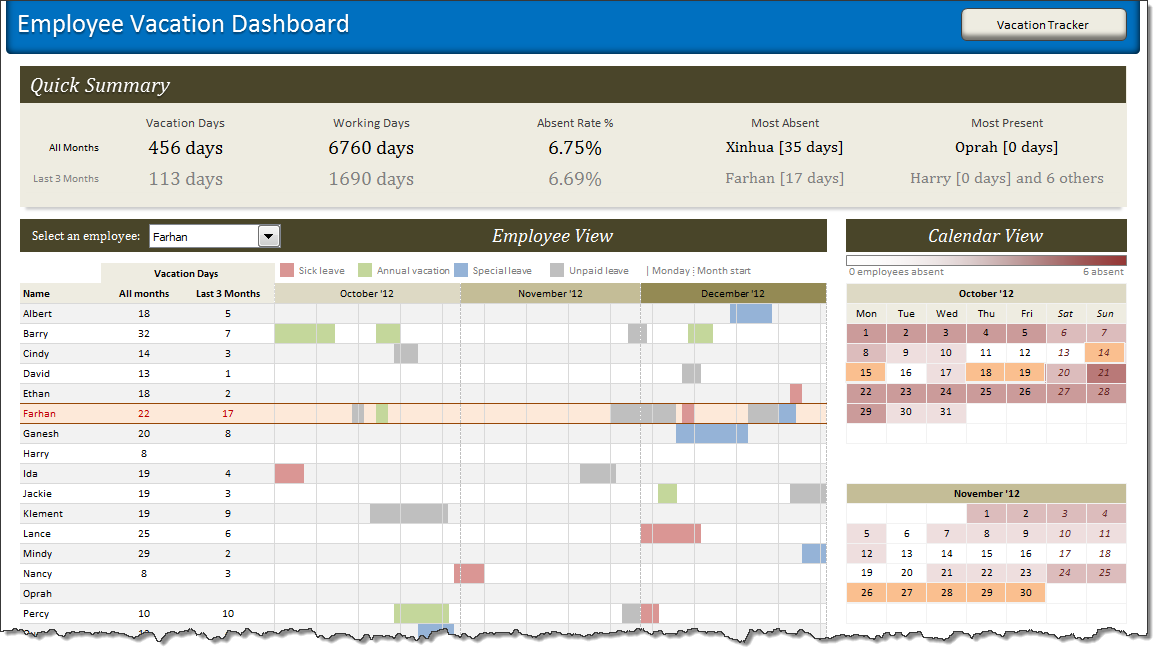
HR managers & department heads always ask, “So what is the vacation pattern of our employees? What is our average absent rate?”
Today lets tackle that question and learn how to create a dashboard to monitor employee vacations.
What do HR Managers need? (end user needs)
There are 2 aspects tracking vacations.
1. Data entry for vacations taken by employees
2. Status dashboard to summarize vacation data
{ 63 Comments }
To-do List with Priorities using Excel
Published on Jan 7, 2013 in Excel Howtos, Templates
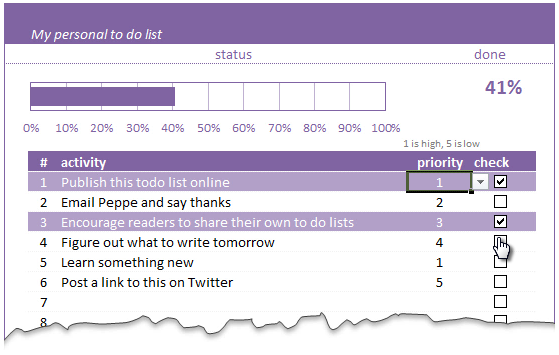
A while ago, we published a new year resolution template. This was a hit with our reader with thousands of you downloading it. During last week, Peppe, one of our readers from Italy, took this template and made it even more awesome.
The original template had tasks and completion check mark. As you finish each task, you can see the progress bar moving.
Peppe added priorities to this. With his new version, progress is measured based on how much priority we assigned that particular task. Pretty neat eh?!?
Continue »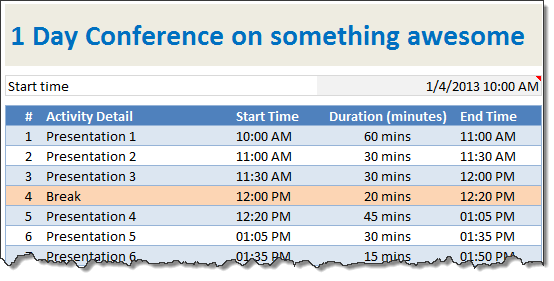
When planning a meeting, an event or activity, we deal with many individual steps (each taking certain amount of time). Today let us understand how to create an agenda template in Excel using simple formulas.
Continue »2012 has been the most awesome year since we started Chandoo.org.
The credit for this goes to our community of Excel users – that is you.
For practically every day of 2012, you have inspired me (and all of us at Chandoo.org) to learn something new, share and make you awesome. I know I say this many times, but I can never feel enough – Thank you for your support to Chandoo.org.
Apart from you, there are many other amazing people & companies that played a role in our success. In this post, let me highlight them & express my sincere gratitude.
Continue »![2013 Calendar – Excel Template [Downloads]](https://img.chandoo.org/c/2013-calendar-template-FREE-download.png)
Here is a New year gift to all our readers – free 2013 Excel Calendar Template.
This calender has,
- One page full calendar with notes, in 4 different color schemes
- Daily event planner & tracker
- 1 Mini calendar
- Monthly calendar (prints to 12 pages)
- Works for any year, just change year in Full tab.
{ 33 Comments }
Monitoring Monthly Service Levels using Excel Charts [Example]
Published on Dec 20, 2012 in Charts and Graphs
![Monitoring Monthly Service Levels using Excel Charts [Example]](https://img.chandoo.org/c/service-levels-7-years-excel-chart.png)
Recently, I wrote a tutorial on tax burden in USA chart.
Jared, One of our readers liked this chart very much. Jared works as a workforce scheduler and has data similar to our chart. So he applied the same technique to analyze monthly service levels for last 7 years & sent me the file so that I can share it with all of you.
First take a look at the demo of Jared’s chart. And read on to know how this works.
Continue »
Rama, one of our readers emailed this:
I Have Many List boxes In That I need to Hide Few Of them Using Check box
Show Hide list boxes by using a check box
We can use check box and a bit of VBA to do this easily. Something like above demo.
Read on to learn how to do this using Excel & VBA.
Continue »{ 240 Comments }
Can you find that pattern? [Homework]
Published on Dec 14, 2012 in Excel Challenges
![Can you find that pattern? [Homework]](https://img.chandoo.org/hw/can-you-find-that-pattern-excel-homework.png)
Are you ready for an Excel challenge?
Today, your job is very simple. Just find a pattern in a text and return corresponding value.
Your Homework:
In a range we have some resource types & their billing rates.
In another range, we have some descriptions. Each description contains a resource type somewhere inside it. We need to retrieve billing rate for each description by looking up which resource type is mentioned in it.
See above diagram.
Continue »{ 12 Comments }
Highlight best week & month in a trend chart [tutorials]
Published on Dec 12, 2012 in Charts and Graphs
![Highlight best week & month in a trend chart [tutorials]](https://img.chandoo.org/c/highlight-best-week-month-in-trend-charts-excel-howtos.png)
When analyzing business data like sales, shop visits or productivity, one of the questions managers always ask is,
What is the best month / week for this data?
To answer this question, we need to make a chart that looks like above. Today, lets learn how to highlight portions of such charts that correspond to best week or best month.
Continue »{ 2 Comments }
Dressing Financial Statements – What Motivated Mr. Bean to Defraud Latte?
Published on Dec 11, 2012 in Financial Modeling
Did you know What Happened at Last Coffee Day?
Mr. Bean “dressed up” the financial statements and was caught in the fraud. But he was the CEO of Latte! So why did he commit fraud in his own company??
Any Guess?
Take a cappuccino and I will give you a hint – How was Mr. Bean’s Bonus to be decided?
Read on to know more…
Continue »{ 38 Comments }
How the tax burden has changed over the years – Excellent chart by NYTimes & Redoing it in Excel
Published on Dec 6, 2012 in Charts and Graphs
If I need some charting inspiration, I always visit New York Times. Their interactive visualizations are some of the best you can find anywhere. Clear, beautifully crafted and powerful. Long time readers of Chandoo.org knew that I like to learn from visualizations in NY Times & redo them using Excel.
Today let me present you one such chart. This is based on an interactive visualization prepared by NY Times explaining how the tax burden has changed over years for various income groups.
Take a look at tax burden chart – Excel implementation
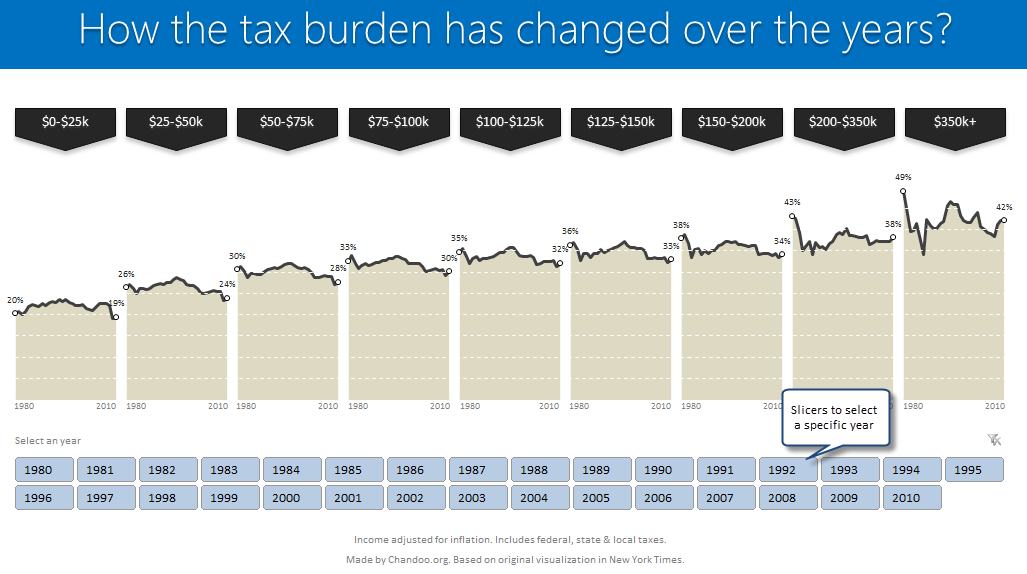
Read on to learn how to create this chart using Excel.
Continue »
