All articles with 'data series' Tag
![Project Management: Show Milestones in a Timeline [Part 3 of 6]](https://chandoo.org/img/pm/project-timeline-chart-excel-th.png)
Learn how to create a timeline chart in excel to display the progress of your project. Timelines are a good way to communicate about the project status to new team members and stake holders. Also, download the excel timeline chart template and make your own timeline charts.
Continue »Create a Combination Chart, Add Secondary Axis in Excel [15 Second Tutorial]
Two most commonly asked or searched queries when it comes to charting are,
- How to combine two chart types in one chart, like a line chart combined with bar chart?
- How to add a secondary axis to the chart so that one or more data series are plotted on the secondary axis?
Watch this video tutorial to learn how to do both in less than 15 seconds.
Watch it on youtube: Creating combination charts and adding secondary axis – video tutorial
Continue »Visualizing Search Terms on Travel Sites – Excel Dashboard

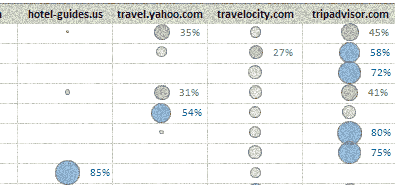
Microsoft excel bubble chart based Visualization to understand how various travel sites compete search terms
Continue »Excel Links of the week – the Christmas edition
It is the holiday week, that means less posts and more fun. We went to a friend’s wedding yesterday and had wonderful time. We are planning to celebrate Christmas at home with friends this year. How are you celebrating the holidays this year?
Continue »

