All articles with 'Microsoft Excel Conditional Formatting' Tag
![Gantt Charts – Project Management Using Excel [Part 1 of 6]](https://chandoo.org/img/pm/gantt-chart-project-plan-thumb.png)
This is a 6 part tutorial on project management using microsoft excel. These posts represent few of the things related to project management using excel that I have learned over the years. The first installment deals with Preparing & tracking a project plan using Gantt Charts in MS Excel.
The other parts I am planning are, Day to day operations – using to do lists, Preparing a project time line, Time sheets and Resource management, Tracking issues and risks, Project Status Reporting – Dashboard.
Read the first part of the article to learn how to make excel gantt charts / project plans.
Continue »{ 25 Comments }
Search a Spreadsheet Full of Data using Conditional Formatting
Published on Mar 31, 2009 in Learn Excel

Many of us use spreadsheets to manage huge lists of data, like customer data bases, salesperson data bases etc. Today we will learn a little conditional formatting trick that you can use to search a worksheet full of data and highlight the matching cells.
Continue »{ 61 Comments }
Highlight Top 10 Values using Excel Conditional Formatting
Published on Mar 17, 2009 in Excel Howtos, Learn Excel

In excel conditional formatting basics article, we have learned the basics of excel conditional formatting. In this article we will learn how to highlight top 5 or 10 values in a list using excel as shown aside. We will use LARGE excel formula and conditional formatting to do this.
Continue »{ 82 Comments }
Excel Conditional Formatting Basics
Published on Mar 13, 2009 in Excel Howtos, Learn Excel
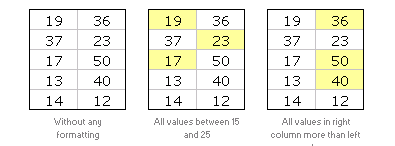
Do you know What is excel conditional formatting? Learn the basics, few examples and see how you can use it in day to day work in this installment of spreadcheats.
Continue »{ 10 Comments }
Market Segmentation Charts using Conditional Formatting
Published on Feb 18, 2009 in Charts and Graphs, Learn Excel
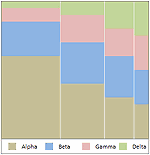
Trust Peltier to come up with solutions for even the most impossible looking charts. Today he shares a marimekko chart tutorial. I couldn’t sit still after seeing his post. So here comes market segmentation charts or marimekko charts using,
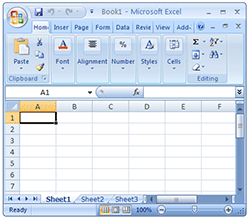
After a really long wait finally I have used … Excel 2007 (drum roll) and contrary to what many people think, I have found Excel 2007 to be a very well designed piece of software. Of course there are various issues with it and I am sure folks at MS are working on them so that next versions of MS Office are much more pleasant and simpler to use.
I wanted to share 10 wow factors in Excel 2007 that may convince you to try it.
Continue »
Yesterday I have learned this cool excel charting trick and I cant wait to share it with you all. The problem: I have too many charts & want to show one based on selection You have made 3 charts to show your company performance in the last 8 years. But you don’t want to clutter […]
Continue »{ 32 Comments }
More than 3 Conditional Formats in Excel
Published on Oct 14, 2008 in Charts and Graphs, Learn Excel

One of the most popular posts on this blog is how to become excel conditional formatting rock star. Quite a few commenters there asked me if there is a way to get more than 3 (or 4) conditional formats in excel 2003. Like what you see below: You can get more than three conditional formats […]
Continue »![KPI Dashboards – Highlight KPIs Based on Percentile [Part 3 or 6]](https://chandoo.org/wp/wp-content/uploads/2008/09/kpi-dashboard-3-thumb.jpg)
Creating KPI Dashboards in Microsoft Excel is a series of 6 posts by Robert from Munich, Germany. This 6 Part Tutorial on KPI Dashboards Teaches YOU: Creating a Scrollable List View in Dashboard Add Ability to Sort on Any KPI to the Dashboard Highlight KPIs Based on Percentile Add Microcharts to KPI Dashboards Compare 2 […]
Continue »{ 53 Comments }
Conditionally play sounds when a cell value changes
Published on Aug 4, 2008 in hacks, Learn Excel
Blog reader Richard asks through email: I’m a non-programing user of Excel. I import stock prices, using what is called ( I believe) a dde link, into my spreadsheets,from a trading program. I would like to add a feature to my spreadsheets that, like conditional formatting, alerts me to a price change in a cell, […]
Continue »{ 36 Comments }
Excel Bullet Graphs
Published on Jul 21, 2008 in Analytics, Charts and Graphs, Featured, hacks, ideas, Learn Excel, technology
Bullet graphs provide an effective way to dashboard target vs. actual performance data, the bread and butter of corporate analytics. Howmuchever effective they are, the sad truth is there is no one easy way to do them in excel. I have prepared a short tutorial that can make you a dashboard ninja without writing extensive […]
Continue »Jon @ Peltiertech has taken a critical look at the partition charts suggested yesterday. You can read his review of the partition charts here. One of the commenters on his site said, Jon, the partition chart is not that bad. It just needs to be defragmented… 🙂 So I de-fragmented my partition chart, this time […]
Continue »
Excel conditional formatting is a hidden and powerful gem that when used well, can change the outlook of your project report / sales budget / project plan or analytical outputs from bunch of raw data in default fonts to something truly professional and good looking. Better still, you dont even need to be a guru […]
Continue »
