All articles with 'calculate()' Tag
{ 9 Comments }
Top 5 with above average – Power Pivot Trick
Published on Aug 13, 2018 in Power Pivot

Welcome to Power Mondays. Every Monday, learn all about Power BI, Power Query & Power Pivot in full length examples, videos or tips. In this installment, learn how to get top 5 list with a twist.
Let’s say you are analyzing sales data and you want to know who are your top 5 sales persons?
Of course, this is simple, you just create a pivot to see total sales by person and then sort the pivot. First five rows have the answer you need. You can even apply a value filter > top 5 to show only their data.
Continue »{ 11 Comments }
How to get percentage of something calculations in Excel Pivot Tables
Published on Aug 1, 2018 in Pivot Tables & Charts, Power Pivot

Ever wondered how to get percentage of another value in Excel pivot tables, like this: In this tip, learn how to create such calculations using Excel pivot tables. Note: this tip is not compatible with older versions of Excel. If you are using Excel 2007 / 2010 / 2013, then please install free Power Pivot […]
Continue »
Commonwealth games 2018 have ended in the weekend. Let’s take a look at the games data thru Power BI to understand how various countries performed.
Here is my viz online or you can see a snapshot above.
Looks good, isn’t it? Well, read on to know how it is put together.
Continue »{ 4 Comments }
Distinct Count & Blanks – Power Pivot Real Life Example
Published on Feb 11, 2013 in Power Pivot
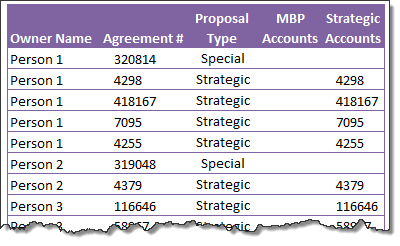
When it comes to analyzing business data, managers are always asking, “so how many distinct x each y is doing?”
And that sends us, data analysts & reporting professionals running from pillar to post figuring out the best way to do it.
- We can use variations of SUMPRODUCT, COUNTIFS etc, but the methods are not flexible..
- We can use VBA, but it would become slow as you add more data.
- We can use Pivot tables, but it only gives half of what we want ie each y part, but not distinct count of x.
- We might as well shave our head with a shovel before manually counting values.
And that brings us to 2 distinctly simple solutions:
- Using Power Pivot & Excel 2010
- Using regular pivot tables in Excel 2013
Today, lets talk about these 2 approaches & see why they are so better than anything else for distinct count situations.
Continue »
