All articles with 'advanced excel' Tag
Data and Calculations for our Customer Service Dashboard [Part 2 of 4]
![Data and Calculations for our Customer Service Dashboard [Part 2 of 4]](https://img.chandoo.org/dashboards/variables-in-our-customer-service-dashboard.png)
Welcome back. In part 2 of Making a Customer Service Dashboard using Excel let us learn how the data & calculations for the dashboard are setup.
Designing Customer Service Dashboard
Data and Calculations for the Dashboard
Creating the dashboard in Excel
Adding Macros & Final touches
In this installment, we will examine all the variables, named ranges & various formulas that drive our dashboard. Also, you can download the full dashboard workbook and play with it to examine these formulas and learn better.
Continue »14 ways to check if an year is leap year, using Excel [just for fun]
![14 ways to check if an year is leap year, using Excel [just for fun]](https://img.chandoo.org/f/checking-if-an-year-is-leap-year-using-excel.png)
Today is February 29th, and that means, this year we have one more day to be awesome. So lets celebrate it in Excel style!
Lets learn 14 different ways to tell if an year is leap year, using Excel Formulas.
Why 14? because, we are awesome like that.
Continue »How to add your own Macros to Excel Ribbon [quick tip]
![How to add your own Macros to Excel Ribbon [quick tip]](https://img.chandoo.org/q/add-your-own-macros-to-excel-ribbon.png)
Do you know that in Excel 2010 you can create your own Ribbon tabs and add anything to them, including your own macros? Today, we are going to take a look at this useful feature and learn how to add your own macros as buttons to Excel Ribbon. Steps to Add your own macros to […]
Continue »Designing a Customer Service Dashboard in Excel [Part 1 of 4]
![Designing a Customer Service Dashboard in Excel [Part 1 of 4]](https://img.chandoo.org/dashboards/customer-service-dashboard-excel.png)
Sawadee Krup folks. Today, we begin a new series on Chandoo.org – Making a Customer Service Dashboard using Excel. This 4 part tutorial teaches you,
Designing Customer Service Dashboard
Data and Calculations for the Dashboard
Creating the dashboard in Excel
Adding Macros & Final touches
Customer service is one area where a lot of data is collected regularly. Understanding all this and making business decisions is quite complex task. This is where dashboards shine.
Read on to learn how to design customer service dashboards.
Continue »
Formula Forensics is on Vacation.
Formula Forensics is actually on a working Holiday and has visited the Excel Hero Academy this week.
So today in Formula Forensics we will showcase some of the work that have been derived from the learning’s at the Excel Hero Academy.

Project Managers often report financial numbers to the management. In a dynamic world, these numbers are usually based on a lot of factors that may or may not be under your control. So the top management demands that the numbers be reported as per different economic scenarios – Optimistic, Normal or Pessimistic. It is important […]
Continue »
One of the most dreaded courses during my under-graduation is Probability, Statistics & Queuing Theory. We called it PSQT. I struggled to understand the significance and concept of this course as I could barely concentrate in the class. We had a professor, who is probably a genius, but the moment he started the class, I would magically fall in to one of my after-noon naps. When I woke up, we are either in the middle of an elaborate t-test or going thru intricacies of a Markovian queue.
This was all 11 years ago. Later in life, I have embraced the world of probability & statistics. I still fear queues. May be I will get there one day. 😉
A good understanding of statistics & probability theory is necessary if you want to model complex real-life problems using Excel or similar tools. Naturally, Excel has several functions, features & supported add-ins to help you in this area.
Today, I want to share some of this with you. This article is broken down in to 3 parts.
- Learning Statistics & Probability using Excel
- Downloadable Excel Workbooks to understand
- Full blown models & simulations in Excel
Compare 2 Lists Visually and Highlight Matches

Comparison is one of the most common things we do with Excel. Naturally, there are so many ways to compare 2 lists of data using Excel.
Today, I want to share an interesting comparison problem with you.
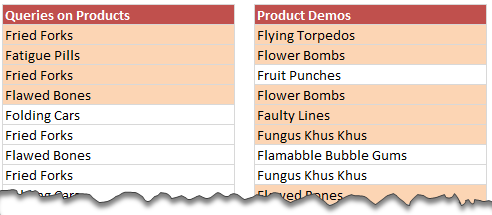
Lets say you run a small shop which sells some highly specialized products. Now, since your products require quite some training before customers can buy them, you keep track of all product queries and arrange demos.
After a hectic week, you are staring at 2 lists. One with product queries, another with product demos. And you want to know whether all the queries are answered with a demo or not.
Continue »Split an Excel File in to Many using VBA [Videos]
![Split an Excel File in to Many using VBA [Videos]](https://img.chandoo.org/vba/splitting-excel-files-sample-data.png)
Splitting an Excel file in to many is easier than splitting bill in a restaurant among friends. All you need is advanced filters, a few lines of VBA code and some data. You can go splitting in no time.
Context:
Lets say you have lots of data like this in a file. And you want to split this in to multiple files, one per salesperson.
Solution – Split Data in to Multiple Files using Advanced Filters & VBA
The process of splitting data can be broken down to 4 steps …,
Continue »Filter values where Fruit=Banana OR Sales>70. In Other Words, How to use Advanced Filters?

Filtering is a simple yet powerful way to analyze data. When you apply filters to any list of values, Excel gives you some really useful pre-defined filters so that you can analyze the data in a variety of ways. So, assuming you have data like this: We all know how to filter data for Bananas. […]
Continue »Sum of Values Between 2 Dates [Excel Formulas]
![Sum of Values Between 2 Dates [Excel Formulas]](https://chandoo.org/img/f/sum-of-values-between-2-dates.png)
Lets just say, you run a nice little orange shop called, “Joe’s Awesome Oranges“. And being an Excel buff, you record the daily sales in to a workbook, in this format. After recording the sales for a couple of months, you got a refreshing idea, why not analyze the sales between any given 2 dates? […]
Continue »How to use Cells, Ranges & Other Objects in Excel VBA

In part 3 of our VBA Crash Course, we are going to learn how to speak with various Excel objects like Cells, Ranges etc. and deal with them.
Objects – what are they?
Any thing and everything is an object. Your dog, your bed, your neighbors cat, their car, your bike, your computer, the shiny new Excel workbook you just created, my website, your email account – every thing is an object.
From our “We are nuts” example yesterday, you can already see these objects:
One awesome owner (that is you)
24 store manager objects
24 store objects
Check if a Word or Phrase is Palindrome using Excel Formulas [Weekend Fun]
![Check if a Word or Phrase is Palindrome using Excel Formulas [Weekend Fun]](https://img.chandoo.org/f/check-for-palindrome-excel-formulas.png)
The other day, while I was putting my kids to sleep, this idea came to me. How do I check if a cell contains a palindrome, using Excel formulas?
Next morning, I wrestled with excel for about 20 minutes and boom, the formula is ready.
But what is a palindrome?
A palindrome is a word, phrase, verse, or sentence that reads the same backward or forward. For example: A man, a plan, a canal, Panama!
So, to check if a cell contains palindrome, we need to reverse the cell contents and see if both original and reverse are the same.

You’ve been there before. It’s almost 5:00, and you are going crazy trying to finish the presentation due for a monthly performance meeting the next morning. The model is refreshed, and now it just takes a LOT of copying, pasting, and positioning to get the PowerPoint ready. Finally, the slides are finished…, until you read a new message from your boss requesting a minor change. But of course her change means you have to start all over with the copy and pastes…
There is always a better way! In the Oil and Gas industry, I constantly have monthly reports to assess the performance of our operating assets. Excel VBA makes it a cinch to automate the entire process. So when a simple change is requested, the presentation is automatically generated with the click of a button. No more wasting time!
Continue »Scenario Analysis for the Project Valuation [Financial Modeling]
![Scenario Analysis for the Project Valuation [Financial Modeling]](https://chandoo.org/wp/wp-content/uploads/2011/07/clip_image004_thumb.jpg)
Few months ago, we learned how to create a project valuation model in Excel as part of our series on Financial Modeling in Excel.
My Project Evaluation Model had a limitation!! In one of the personal comments that I received, the reader pointed out an important problem!
Continue »

