![Charts of the Week [Sep 19]](https://chandoo.org/wp/wp-content/uploads/2008/09/your-life-in-bubbles.jpg)
Thankfully power is back in Ohio, almost 2 days ago to my house. There is another personal update: We are moving to Seattle. My consulting work in Columbus was over 2 weeks back and since then I have been waiting for the next assignment. Finally this week it became clear that we have to move […]
Continue »
There are few charts in excel that are as revolting as a radar chart. The purpose of a radar chart is to compare m options across n parameters so that audience can be convinced that option A is better than say option B. But, I am yet to come across a radar chart that tells […]
Continue »
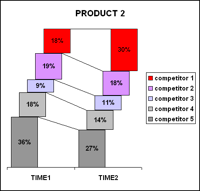
One of our readers Jennifer mailed me with this excel charting problem she is having. I thought why not ask other readers for their advice on this. So here it goes: The Charting Challenge – Visualizing Changes in Market Share Here is an excerpt from her email: The gist of my problem is how to […]
Continue »
In India salary is usually paid on the last working day of a month – the payday. It is slightly different in countries where payrolls are processed every 2 weeks. For eg. in US most companies pay salary on every 2nd Friday / Thursday. We can calculate the paydays / payroll periods in excel with […]
Continue »
My guest post on monitoring web page changes using google docs is posted in Digital Inspiration – one of the most popular technology blogs. Do read it to learn a little bit about using XPATH, RSS Feeds, Google Spreadsheet import() functions. Here is a summary of the technique: First go to the web page which […]
Continue »We have a major power outage in Ohio due to a wind storm on Sunday. AEP, Our electric provider says that power would be restored to my area by this Friday midnight, that is almost 6 days without power. I will not be able to blog regularly during this period. So here is a list […]
Continue »


