All articles in 'Analytics' Category
Doing the NY times Olympic medals by country year visualization in excel

When I saw the Olympic medals won by each country by year infographic on nytimes my jaw almost dropped, go ahead see it and come back, I am sure you will love it too. It is one of the coolest visualizations I have seen in the recent past and I see infographics all the time, […]
Continue »Excel Bullet Graphs

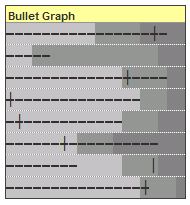
Bullet graphs provide an effective way to dashboard target vs. actual performance data, the bread and butter of corporate analytics. Howmuchever effective they are, the sad truth is there is no one easy way to do them in excel. I have prepared a short tutorial that can make you a dashboard ninja without writing extensive […]
Continue »Bingo / Housie Ticket Generator in Excel

I am fascinated by board games. They provide immense fun, anyone can enjoy them, they are unpredictable and best of all they are great value for money. That is why whenever I get sometime I experiment with simulating games to know them better. So, out of curiosity I have created an excel sheet that can generate bingo / housie (housey) tickets – 24 of them at a time. To get new set of tickets you would hit F9 (recalculate).
Continue »![Partition Charts in Excel – alternative to pie charts [visualization hack]](https://chandoo.org/wp/wp-content/uploads/2008/07/partition-charts-in-excel.gif)
Next time you had to create a pie chart, consider building a partition chart as these charts can reveal trend information along with how much each pie is contributing. What more? They are as easy to create as eating a chocolate chip cookie dough ice cream 🙂 I made a sample partition chart based on […]
Continue »I was doing some weird analysis on corporate mission statements and I had to count the number of words in each cell. That is when I realized there is no formula to calculate the number of words in a cell, I was too lazy to write an UDF for that, so I figured out a […]
Continue »Time for another look at print ads, this time for the most bizarre of them all. Mind you, these are not awful or plain lousy ads, for any column-centimeter worth its area has a fair share of lousy ads, these are simply bizarre ads, the kind that will make you go – WTF? The first […]
Continue »Like this? Feel free to share / copy / exploit / save the cartoon. See other powerpoint cartoons as well
Continue »
Excel conditional formatting is a hidden and powerful gem that when used well, can change the outlook of your project report / sales budget / project plan or analytical outputs from bunch of raw data in default fonts to something truly professional and good looking. Better still, you dont even need to be a guru […]
Continue »As you all may know I have recently moved my blog from blogger to wordpress. Since I have started blogging way back in 2004 most of my posts were untagged. I have used blogger labels ever since they were introduced, still almost 400 of my posts were untagged. I had two options, Manually edit posts […]
Continue »3 Steps to Create cool dashboards in excel
Dashboards are very common business monitoring tools, but creating them in excel with all the bells and whistles is not so easy. So here is a quick 1-2-3 on how to do it. Lets take a sample of 2 consecutive year sales figures for 7 regions. The colums have Region name, 2004-05, 2005-06 figures and […]
Continue »How to Get Unique Items using Excel
I recently had to perform some analysis on a set of insurance companies in certain geography. After searching the net I found such list of companies operating in that continent. But the problem is, These companies are listed multiple times, one time for each of their geographical area of operation. I cannot count each company […]
Continue »

