Details about our Power Pivot Course [and a video for those of you not interested]
Hello folks,
If this article was a person, they would be schizophrenic. You see, it has 2 purposes:
- Give you all the details about my upcoming Power Pivot course
- Give you a solution to last week’s vacation days problem
Details about Power Pivot Course
Power Pivot, an Excel add-in makes it easy to connect, analyze & visualize massive amounts of data. This course aims to teach you how to use Power Pivot to analyze data, create advanced reports & prepare dashboards all from familiar interface of Excel. This is ideal for data analysts, reporting & MIS professionals, business analysts, managers & dashboard makers.
Introduction to DAX Formulas & Measures for Power Pivot
A measure is a formula for the values area of Power Pivot table.
A measure can be implicit or explicit.
Implicit measures are created automatically when you drag and drop a field in to Power Pivot values area. For example, in last week’s introduction, we created an implicit measure for SUM of Sales by dragging and dropping the sales amount field in to values area of our power pivot table.
Explicit measures are created by you using New measure button in Power Pivot tab (or Calculated Field button in Excel 2013 Power Pivot tab). You can also create a measure in the Power Pivot window.
Learn what measures are, how to create them using DAX (Data Analysis Expression) formulas in this video tutorial.
Can you calculate vacation days in a period? [Homework]
Its Friday, that means time for another Excel challenge for you.
Calculate vacation days in a period:
Your mission, if you choose to accept it,
Step 1: Download the hom work problem file.
Step 2: Calculate number of vacations taken in a period. Specifically,
1) How many vacations are taken between start & end dates, assuming complete vacation should be inside the start & end date period?
2) How many vacations are taken such that at least one day of vacation is between start & end dates?
3) How many people took vacations? (if same person took multiple vacations, then count it as 1)
Designing a dashboard to track Employee vacations [case study]

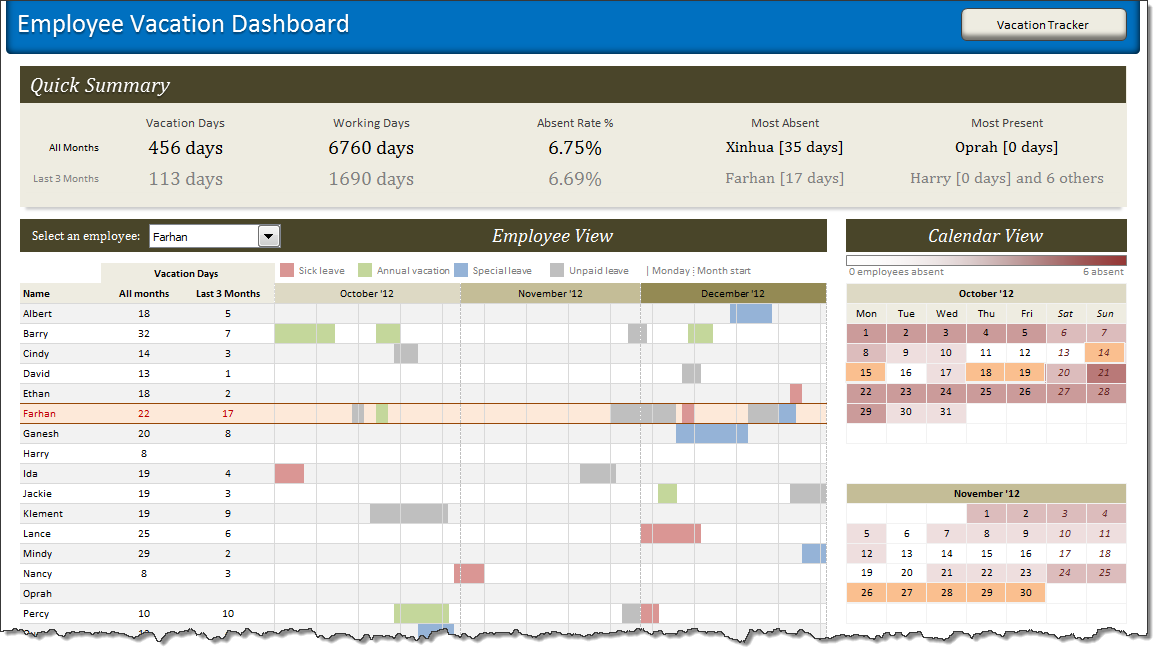
HR managers & department heads always ask, “So what is the vacation pattern of our employees? What is our average absent rate?”
Today lets tackle that question and learn how to create a dashboard to monitor employee vacations.
What do HR Managers need? (end user needs)
There are 2 aspects tracking vacations.
1. Data entry for vacations taken by employees
2. Status dashboard to summarize vacation data
What is Power Pivot – an Introduction [video]
Today, lets talk about Power Pivot & understand it.
What is Power Pivot?
Power Pivot is an Excel add-in to connect, analyze & visualize massive amounts of data..
Lets take a closer look at the definition.
Connect: You can use multiple tables of data & set up relationships between them using Power Pivot. For example, you can connect customer details to sales transactions so that you can summarize sales by customer location or gender easily.
Analyze: You can create simple pivot table style reports or create something exceedingly complex by defining your own calculated fields for values area of the pivot. There is a whole set of formulas defined for exactly this purpose, called as DAX formulas.
Visualize: Instantly filter your reports using slicers, time lines (Excel 2013 or above only), conditional formats, pivot charts etc. You can even define KPIs and see the performance in bands.
Massive Amounts of Data: Although your typical Excel worksheet contains a million rows, if you tried to load even half of those with any data, Excel would quickly become slow & lazy. Power Pivot can take a million rows for breakfast and would be hungry for more. It can processes millions of rows of data very quickly and easily, all from the comfort of a standard desktop or laptop.
Top 10 Formulas for Aspiring Analysts
Few weeks ago, someone asked me “What are the top 10 formulas?” That got me thinking.
While each of us have our own list of favorite, most frequently used formulas, there is no standard list of top 10 formulas for everyone. So, today let me attempt that.
If you want to become a data or business analyst then you must develop good understanding of Excel formulas & become fluent in them.
A good analyst should be familiar with below 10 formulas to begin with.
Insert Multiple Columns at once [Quick tip]
Here is a quick tip to start your week. Ever wanted to insert a few columns in between like this? Here is how to do it. Hold down control key. Select one column at a time Right click and choose Insert Done! Bonus tip: You can use this to insert rows too! More Quick tips.