Archive for December, 2010
{ 11 Comments }
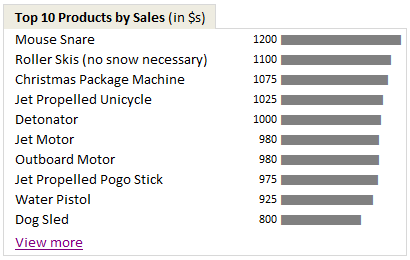
Show Top 10 Values in Dashboards using Pivot Tables
Published on Dec 1, 2010 in Charts and Graphs, Pivot Tables & Charts
A good dashboard must show important information at a glance and provide option to drill down for details.
Showing Top 10 (or bottom 10) lists in a dashboard is a good way to achieve this (see aside). Today we will learn an interesting technique to do this in Excel.
Continue »
