All articles with 'Scroll Bar' Tag
Modelling Inventory Run Rate & Cash Flows using Excel

Imagine you run an office furniture company. You want to stop reordering two brands of furniture – Relaxer (a type of chair) and Boca Top (a type of table). You currently have 20,000 Relaxer chairs and 5,000 Boca Tops. These are valued at $200,000 and $100,000 respectively. When sold, they will yield $100,000 and $25,000 gross profit. You are hoping to sell them off in 2 or 3 years. You forecast that we can sell off these as per some yearly schedule.
You need to analyze this and prepare a cash flow model.
Let’s learn how to answer such open ended questions using various analysis techniques in Excel.
Continue »Are you ready for 2,000 miles, 15 days & 10 Excel tips road trip?

Finally my Excel classes in USA are over. It was a lot of fun traveling to new cities, teaching Excel & dashboards to enthusiastic crowds and making new friends. As if that is not fun enough, we (Jo, kids & I) are going on a 2,000 mile, 2 week road trip starting today.
Although I am enjoying all this, I also feel bad for not taking enough time to share new tricks, ideas & techniques with you here. So, I have a wacky, wild & awesome plan for you. Join us on our road trip.
That is right. You can join me on our road trip and see what I see, learn some pretty cool Excel tricks, all while sipping coffee and stretching legs in the comfort of your office cubicle.
Continue »There is an Easter egg in this chart!

Do not worry, you are not time traveling or seeing things. Its just that, this year I have decided to publish our Easter Egg a few days early.
And oh, I have 3 reasons for it:
- 2 of my favorite festivals – Easter & Holi (a festival of colors, celebrated in India) are this week. Holi is today (Wednesday) & Easter on Sunday.
- My kids are super excited about Holi as this is the first time they will be playing it. So we have family time from today until Wednesday and I do not feel like writing a blog entry on Friday 🙂
- I like to have 3 reasons for everything.
Hence the Easter Egg is advanced a few days. But it is just as fun (or may be better) as previous Easter eggs.
Continue »2012 has been the most awesome year since we started Chandoo.org.
The credit for this goes to our community of Excel users – that is you.
For practically every day of 2012, you have inspired me (and all of us at Chandoo.org) to learn something new, share and make you awesome. I know I say this many times, but I can never feel enough – Thank you for your support to Chandoo.org.
Apart from you, there are many other amazing people & companies that played a role in our success. In this post, let me highlight them & express my sincere gratitude.
Continue »Monitoring Monthly Service Levels using Excel Charts [Example]
![Monitoring Monthly Service Levels using Excel Charts [Example]](https://img.chandoo.org/c/service-levels-7-years-excel-chart.png)
Recently, I wrote a tutorial on tax burden in USA chart.
Jared, One of our readers liked this chart very much. Jared works as a workforce scheduler and has data similar to our chart. So he applied the same technique to analyze monthly service levels for last 7 years & sent me the file so that I can share it with all of you.
First take a look at the demo of Jared’s chart. And read on to know how this works.
Continue »Journey of Hurricane Sandy – Animated Excel Chart

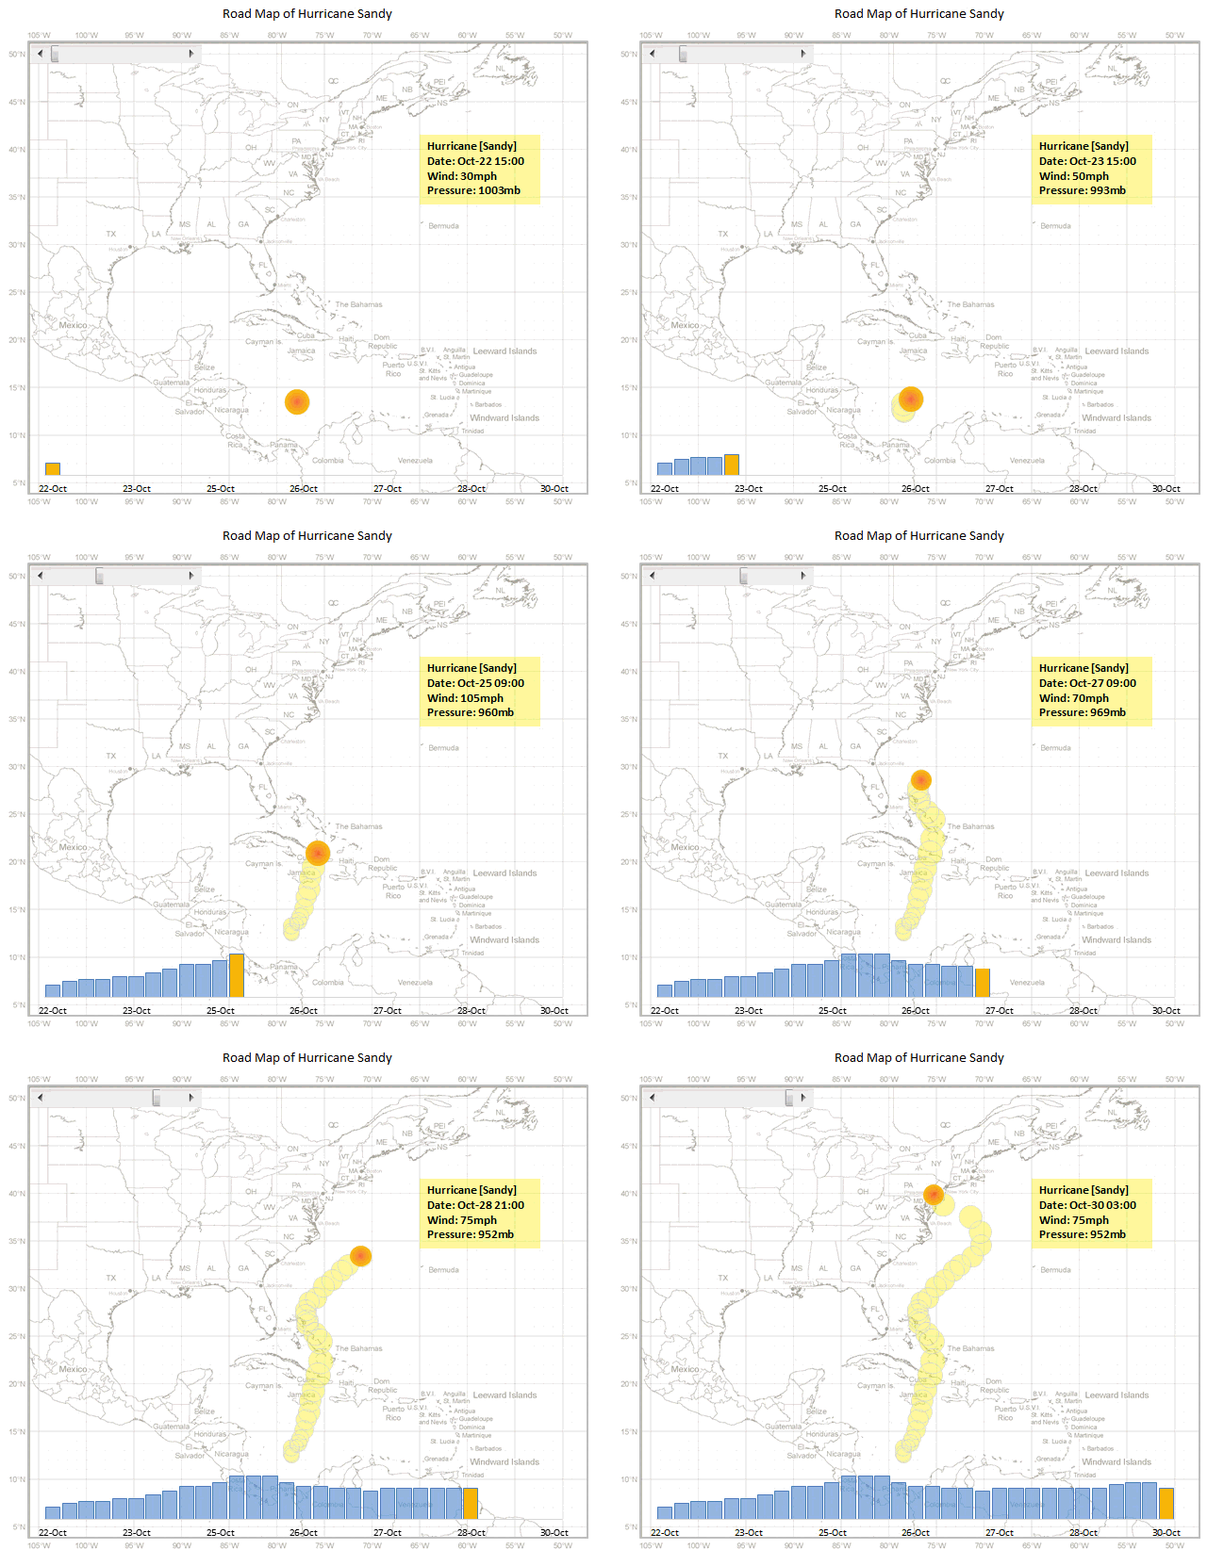
Hurricane Sandy has taken front seat in all major news channels, papers, websites even in far off places like India. I hope & pray that our readers in US East coast are safe.
Today, lets understand the journey of Hurricane Sandy in this animated chart, prepared by Chris from Excel365.
Continue »
Excel can be a bland collection of cells with text and numbers or it can be a playground where you can have interactive engagement with your models.
The choice is yours!
Excel provides a small number of tools to allow you to interact with your models.
These tools are called Form Controls and can be added into and linked to your models data.
This post will look at the various types of Form Controls and discuss their application and use.
Continue »

