
Ok people. Let me tell you that this post is almost not about Excel. It is about how one Excel blogger’s (yours truly) dream of long distance cycling came true. So sit back, grab your favorite drink and read between sips.
PS: if you just want to see the dashboard, click here.
So what is this all about?
Last Sunday (27th July) & Monday (28th), I finished my first ever 200KM bicycle ride. I rode for a little more than 12 hours, burned 5,179 calories & rode 206 kilometers.
It is definitely one of the most memorable, tiresome & uplifting experiences in my life. So naturally, I want to share the story with you.
Where it all began
Around late last year, I read a book called Free Country by George Mahood. It is a story of two young British lads cycling from Lands End to John O’ Groats (from one end of Britain to another) without spending a penny of their own money. While reading the book, I kept thinking, ‘I should do something mildly similar one day’.
But I did not do much cycling in the next several months. Until…,
I read truly inspiring story of how adc cycled from Manali to Leh (500 km). The story is special because the terrain between Manali & Leh is filled with high altitude passes, dangerous mountain roads, harsh weather, almost no habitat & breath taking scenery.
That travelogue motivated me enough to get out my dusty cycle from garage and start riding it.
Soon I was riding 20 KM per day. I started doing a few long rides (~40km) in the weekends to build strength.
Once I felt confident, I discussed my plans for a longer ride with Jo (my wife). She was a little apprehensive as I have never done something like that and long rides could mean increased chance for injury or accident.
Finally we agreed that doing a round trip to Annavaram (a small temple town 118 km away from our home) would be reasonable. The roads to Annavaram are in excellent condition. There is ample help available all the way (plenty of food stops, villages & towns along the way). Plus in case of fatigue or injury, I could easily hitch a ride back home.
I fixed on the dates 27 & 28th of July for ride. Weather app on Jo’s iPad said there is 70% chance of rain. I kept my plans fluid & wanted to ride only if there is no rain in the morning when I started.
Route Map
Here is the route I took (link).
Day 1 – Vizag to Annavaram (118 km, 7:34 hrs riding)
I woke up at 4:45 AM and unlocked the doors immediately to see if there is any rain. No rain and the skies looked ok. I got ready, had a glass of milk & woke up Jo. She gave me a farewell hug and I left the house at 5:24.
The initial 20 km was a breeze to ride. The route so far is familiar as I bicycle on it almost everyday.
After riding 25 km, I took a short water break.
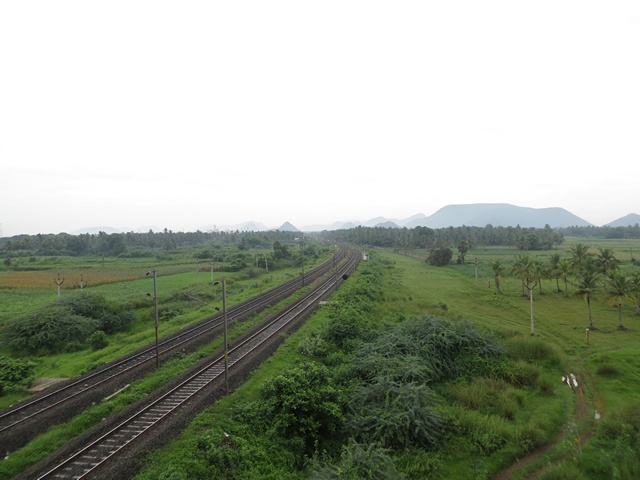
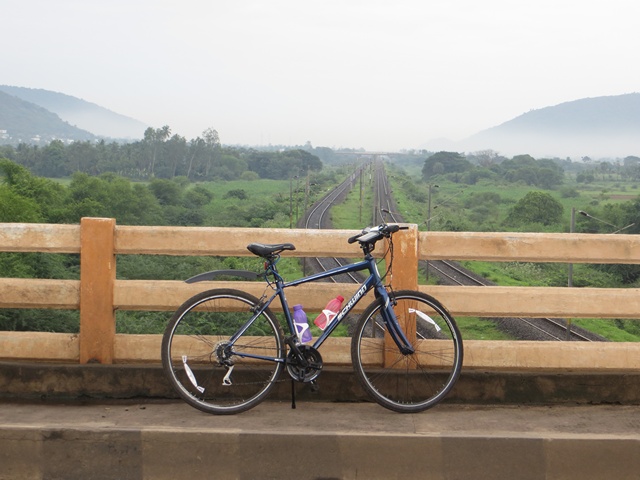
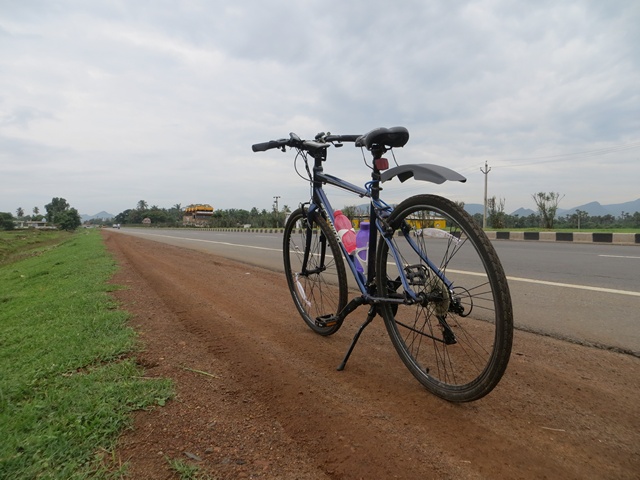
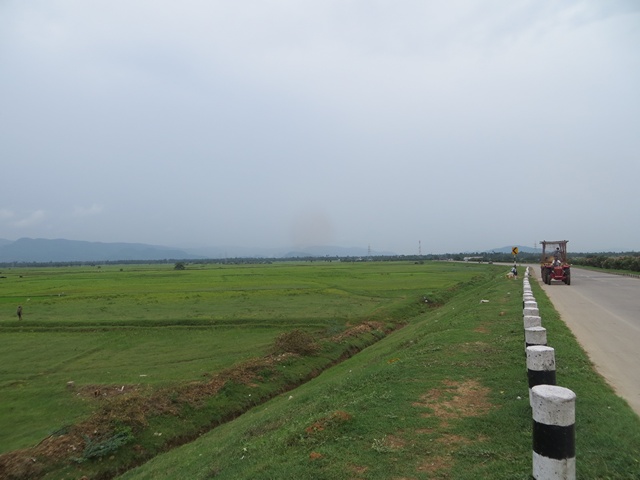
I barely rode for another 4 km and stopped again, this time to enjoy the view from top of a flyover. The rolling hills, green rice fields, railway track, chirping birds & fresh morning air provided perfect setting for a few pictures.
Soon I left the state highway & joined national highway 45 (and 16 too). This is a 4 lane highway with wide shoulder. Unlike in US (and many other western countries), in India bicycles, pedestrians and many other forms of moving objects are allowed on highways. The best part of riding on national highway is that the gradients are better. Next 15 km felt like one long flat ride.
I crossed Anakapalli (a small town on the outskirts of Vizag) and stopped for breakfast at 41 KM mark. 1/3rd distance completed!
After feasting on Idly, Dosa & a tea (traditional breakfast in south India), I resumed the journey at 8:10 AM.
Still no rains. So I rode on.
At around 50 KM mark, stopped for a quick drink of water & electral (oral re-hydration solution made with essential salts & minerals).
Around 60 km mark I started feeling a little thirsty and wanted to stop for some tea. Soon (after 6km) found a road side tea stall. My original plan is to ride until 80k mark and stop for lunch.
But seeing that I finished 66km by 9:56AM, I have decided to ride until Annavaram (my destination for the day) before lunch.
After the tea stop, I rode for another hour to reach Nakkapalli (a small village on the highway). There I saw a fruit juice stall. Immediately stopped to have a full glass of banana juice. The shop owner told me that Annavaram is another 36 km from there. It started drizzling now. I am a little worried that it may rain heavily.
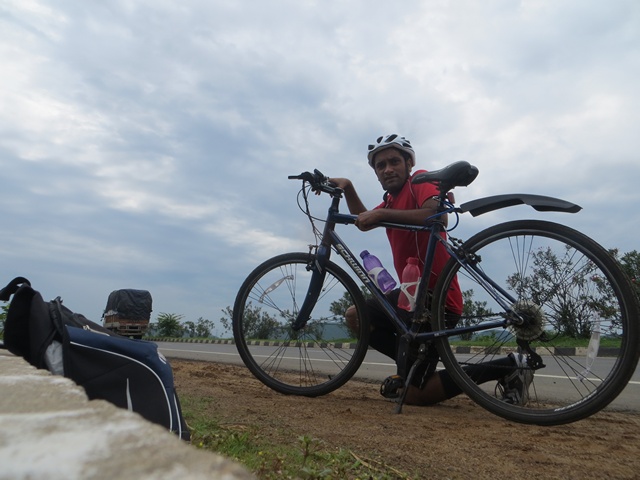
But my fears were unfounded. Soon the skies cleared and I was on a climb. After riding just another 10 km, I had to stop again to quench my thirst and relax a bit. As I was sitting by the road side, a mini truck stopped next to me. the truck driver was curious to know where I am heading & my story. After chatting for a while they left me.
At 95KM mark, I stopped again for a quick snack (snickers bar). Soon 2 kids on a cycle approached me. They are Siva & Siva Ganesh. Siva Ganesh (eldest one, studying 9th class) wanted to test ride my cycle. He was curious to know how the gears work. He took the cycle for a short spin and returned. They spend another 5 minutes with me asking several questions.
Once again I found myself on a steady climb. And then there are strong head winds. My speeds dropped to the range of 10-15kmph. After a lot of pedaling & sweat, I crossed Tuni at 12:30PM.
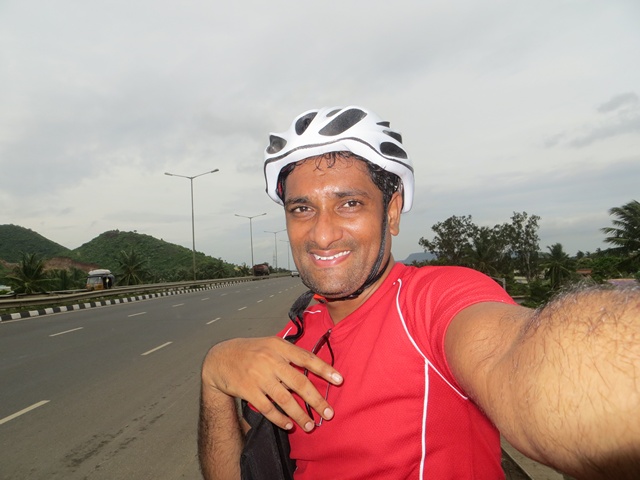
Selfie @ 100km mark
It took me another 30 minutes & 6 km of biking to reach a small temple village called Lova Gudi. By now my water bottles are emptied. So I stopped here to purchase a bottle of water. From here Annavaram (my destination) is 15 km. Normally I would have finished this distance in 40-50 mins. But after riding for 6 hrs, I find myself tired & sweaty. Plus the winds have picked up again. And to top it, almost all of this stretch is a climb.
I took a deep breath and resumed cycling.
The wind & gradient made my task all the more difficult. But I pressed on.
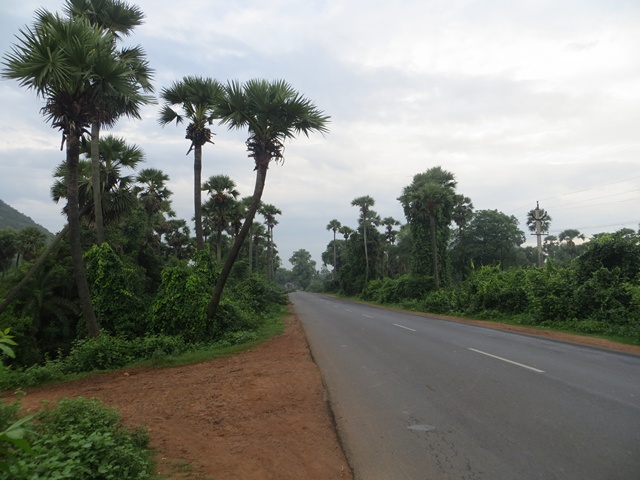
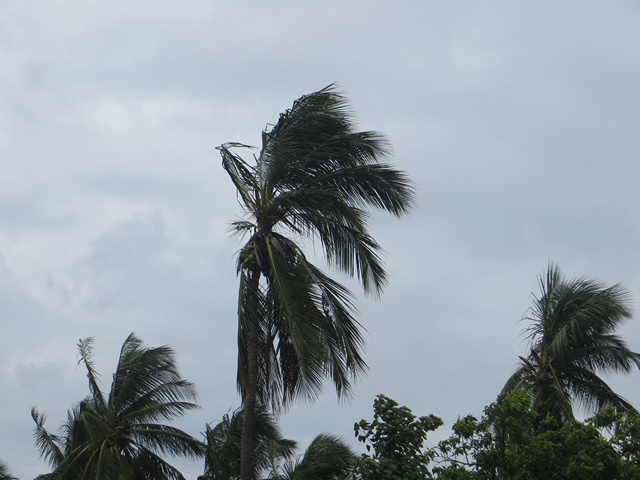
See how harsh the wind is. The coconut leaves are all bent.
About 5 km away from Annavaram (around 110 km mark), someone in a car was waiting for me. As soon as he saw me, he waved his hands and stopped me. Turns out he is a biker from Vizag. He got curious upon seeing the site of a lone biker and wanted to know about me. We chatted for a while and exchanged phone numbers.
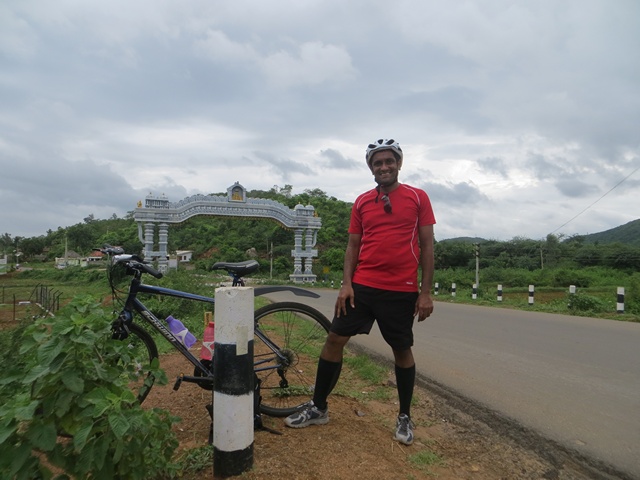
Finally at 2:50 PM, I reached Annavaram village gate. Yay!. It took me more than 9 hours & 30 minutes to reach here. Out of this riding time is 7:30 (it might have been slightly less than this as my tracking app – MapMyRide was not set to autopause for the first 65 km).
Finally, at Annavaram village gate after 9:30 hours of riding.
Day 1 – At Annavaram
I went to the first hotel I can find and ordered lunch. While waiting for lunch, I called Jo & my mom to tell that I reached safely.
After lunch I asked them if they have any rooms to stay. They have vacancies and I immediately took a room. I quickly showered and took a nap. But I could hardly sleep as my thighs and wrists were aching. It looked like I could not ride back and may have to take a bus to my home.
Originally I planned to visit the famous Annavaram temple in the evening. But my legs & back felt too sore to do anything. So instead I went for a short walk to explore the village in the evening.
Later I ordered dinner and watched some football on TV.
Around this time, I have decided to skip the return ride & take a bus instead. I told the same to Jo when I called her to say good night.
I kept waking up in the night due to one pain or other. I turned off the alarm at 6:15 AM and went back to sleep again.
Finally when I woke up at 8:00 I surprisingly felt rejuvenated and ready.
At that moment I decided to ride back home. My plan is to ride as far as I can and then take a bus.
Day 2 – Annavaram to Anakapalli (88 km, 4:30 hrs riding)
After a heavy breakfast & some coffee, I checked out of the hotel and started my return journey at 8:43 AM.
Since I have climbed & gained elevation yesterday, the first 40 km ride from Annavaram was almost downhill mixed with few flats. So I could maintain speeds between 20-30 kmph. At one point I even reached 43.5 kmph, although barely for a minute.
I did not stop anywhere for first 25 km. But then the views by the road are too breathtaking to ignore. So I stopped for a few pictures at 25k mark & again at 27k mark.
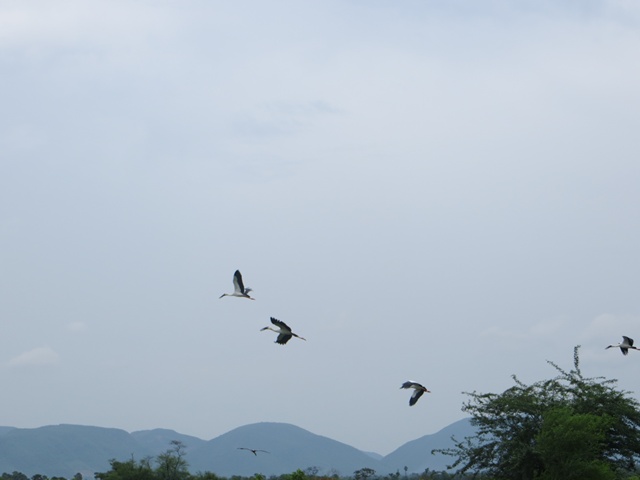
At the later stop, I found several open billed storks in the rice fields. It was a pleasure watching them forage for food & fly elegantly.
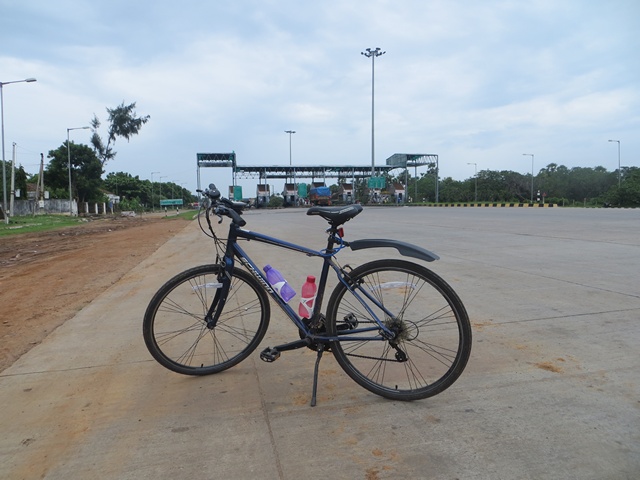
Pretty soon I reached the toll plaza. And yay!, no toll for me. Another reason to bike.
Had to stop again at 10:55AM to appreciate the beautiful green & blue views. Took a few pictures and resumed ride. Reached 50 KM by now.
At this point, I changed my plan to ride for 83 km. This will make the total distance as 200km.
By 11:30, I reached Elamanchali (a small village 20 km away from Anakapalli, my destination for the day). By now it started raining quite a bit. My bike accumulated quite a bit of dirt & soot.
By 1:00 PM, I reached outskirts of Anakapalli and spotted a nice road side restaurant. Immediate stopped there for lunch. As soon as I stopped it started raining heavily. So I had a leisurely lunch spending close to an hour there. Finally the skies cleared at 2 PM and I resumed my ride.
When I was 3 km outside Anakapalli, a gentleman on motorcycle slowed down and rode with me for a few minutes. He asked me several questions about where I am riding, what I do, why I am riding etc. He even invited me to have lunch with him. But I had to decline as I already finished my lunch.
Finally, at 3:06 PM, I finished 88km and stopped my bicycle ride.
An empty mini truck going towards Sabbavaram (half way between where I stopped & my home) offered me a ride.
From Sabbavaram I took an Auto (a 3 wheeled taxi, also called as tuk-tuk) to my home.
And that marked the end of my first ever 200 km bike ride.
My impressions:
Growing up, I used to be the least fit kid in my school. I sucked at all sorts of sports. I got kicked out of football, hockey, badminton, cricket and all other sporting teams in school.
So naturally I assumed that I am not good for athletic activities.
Once I completed my studies and got a job, I realized the importance of living an active life. So I started jogging, cycling and playing sports.
Ever since I quit my job to start my own business, I became even more fitness conscious. Every year (since 2010), I have challenged myself to break personal barriers. When I first considered biking, I could not imaging anything beyond 50km per day. But with practice and motivation, I could finish this ride.
Few thoughts:
- Do a few practice rides: I have been riding 20-30km per day for almost a month before taking up this challenge.
- We underestimate our body: We can take on big challenges, endure pain & perform at our peak so much more than we estimate.
- Drink & Eat well: I call my diet really healthy. We eat home cooked food 90% of the time. Most of our diet is veggies, fruits, milk, nuts, rice & wheat. Almost half of the vegetables & fruits we eat are grown in our back yard. We rarely drink and eat meat once a week.
- Enjoy the ride: Stop and enjoy the scenery. Talk to fellow travelers and take ample breaks. Any distance can be covered easily.
Thanks to
- Jo: for supporting & encouraging me.
- My mom: for not freaking out when she learned about the ride.
- Free Country & ADC: for the motivation
- You: for supporting Chandoo.org so that I can chase my passions.
Now for an Excel Dashboard visualizing the ride
Soon after I got back, I started thinking about analyzing all the ride data. I did what I do best. I created an Excel dashboard to tell the 200km ride story.
Here is a snap shot of the dashboard (click to expand).

Click here to download the Excel Workbook.
It is unlocked. So go ahead and examine the file. Break it apart to understand the logic & formulas. Learn something new & be awesome.
How is this dashboard made?
Here I am going provide only the highlights. Please visit Excel Dashboards page for fantastic tutorials & explanations on how to make dashboards.
- Tables: for structuring ride data. All the ride data came from MapMyRide. I used Doogal.co.uk to get elevation profile of the route.
- Column & line charts: for the splits, speed & elevation.
- Form controls: to make the charts dynamic & to control the Ride pics slideshow.
- Picture links: to show one of the many ride pictures thru scroll bar form control.
- Ample dose of formulas: Mainly INDEX, MATCH, SUMIFS & COUNTIFS.
More personal stories
If you are in the mood to know Chandoo.org & me a little more, check out these:
- Story of Chandoo.org startup
- Thank you, we have a home
- Thank you, we have a car (and another one too)
- Travelogues from my visits to Maldives & Australia
- Confessions of a dad
See you again with more awesome Excel stuff.


38 Responses to “Time to showoff your VBA skills – Help me fix ActiveSheet.Pictures.Insert snafu”
I tried your code with 2003, it works.
But, I know Addpicture does not take URLs anymore with 2007 onwards, perhaps its the same with picture.insert as well.
http://support.microsoft.com/kb/928983/en-us
The above link gives the solution as "picture fill in a shape such as a rectangle".
Tried to recreate this, but it worked fine for me. I just took the image of the error you showed in the post. Is there more info that can narrow this down a bit?
Don't know if this helps?
http://www.theserverside.com/discussions/thread.tss?thread_id=47101
Hi
Not sure if this is what you're after, but I just tried this
Sub Macro1()
ActiveSheet.Pictures.Insert("http://www.google.co.uk/intl/en_uk/images/logo.gif").Select
End Sub
Tied a button to it on the sheet and it seems to work; hope this helps a little
Ian
@All.. the issue is in Excel 2007. In 2003 ActiveSheet.Pictures.Insert seems to work fine. Unfortunately, I have design this in Excel 2007.. that is why I posted it here..
v2
Sub Macro1()
Set n = ActiveSheet.Pictures.Insert("http://www.google.co.uk/intl/en_uk/images/logo.gif")
With Range("c12")
t = .Top
l = .Left
End With
With n
.Top = t
.Left = l
End With
End Sub
Ian
That didn't come out very well. This positions at c12, so can change easily:
Sub Macro1()
Set n = ActiveSheet.Pictures.Insert("http://www.google.co.uk/intl/en_uk/images/logo.gif")
With Range("c12")
t = .Top
l = .Left
End With
With n
.Top = t
.Left = l
End With
End Sub
Works OK in 2007
Ian
The above codes work fines to my EXCEL 2007. Thanks.
Chandoo:
Try 'ActiveSheet.Pictures.Insert'
With ActiveSheet.Pictures.Insert("C:\Example.png")
.Left = ActiveSheet.Range("A1").Left
.Top = ActiveSheet.Range("A1").Top
End With
activesheet.pictures.insert "C:\Documents and Settings\Jon Peltier\Desktop\2007 stuff\insert_charts_2007.png"
Works for me in 2003 SP3 and in 2007 SP2.
Check the URL, and make sure you have internet connectivity.
What also works, and is newer (pictures.insert was supposedly deprecated in '97):
activesheet.shapes.addpicture "C:\Documents and Settings\Jon Peltier\Desktop\2007 stuff\insert_charts_2007.png", false, true, 200,200,100,100
Unfortunately you must specify dimensions (the last four arguments) and you don't necessarily know them. But the picture size is still related back to the original picture size, so you could use scaleheight and scalewidth to fix this.
Chandoo: I just re-read your post.
The code I posted works for me. However, I'm using a local picture. If you try to add a picture from the web, this won't work.
I remember solving this problem before by adding a rectangle shape first, then using the Shapes.AddPicture method to get a picture from the web.
I'll find that code and post it here.
Some more updates... The code "ActiveSheet.Pictures.Insert (path)" works fine in Excel 2007 at home. Strange it failed miserably on my work laptop. Do you think this has got something to do with SP2 of MS Office 2007 or something like that?
@Ian, Jon: Thanks for the code snippets. I guess I will use my home installation of excel to do this.
Chandoo:
Try this on your work laptop:
Sub test()
ActiveSheet.Shapes.AddShape msoShapeRectangle, 50, 50, 100, 200
ActiveSheet.Shapes(1).Fill.UserPicture _
"http://www.datapigtechnologies.com/images/dpwithPig6.png"
End Sub
FYI:
http://support.microsoft.com/kb/928983/en-us
I didn't mean to post code with a local file, because both approaches worked with an internet image as well. This is in Excel 2007 SP2.
activesheet.pictures.insert "http://peltiertech.com/images/2009-07/col_area_noblanks.png"
Jon: Looks like I have SP1 on my client machine! I wasn't paying attention.
Just checked my home computer where I have SP2, and you're right...looks like they fixed it.
I didn't even bother testing in SP1, though I could if anyone cares enough.
I'm afraid I don't have a solution, but I find it remarkable that after attaining a certain status in the Excel world, Chandoo does not need to post on an Excel discussion forum to get help for an Excel problem. Instead, he posts on his blog and all the gurus come rushing to his help.
Isn't Web 2.0 great?
Teylyn - I saw Chandoo's tweet first, and followed the link back to his blog.
@Mike.. thank you. I have seen the fill rectangle solution before posting the query here. For that matter, I have also tried the solution of embedding a browser control on a spreadsheet. both of these seemed a bit extreme. That is why I have asked it here.
But I guess I will end up using it if I had to build this in work laptop.
@Teylyn: I have thought of posting this in a forum. (Unfortunately I have not been to any excel group in the last 5 years. Last time I was active was when I built a jave based excel sheet construction solution using POI.HSSF classes of Apache... ) After searching for a few hours, I found several forum posts where others had same problem and the solution recommended (using .left and .top parameters) is not working for me. Incidentally most of these solutions are from a certain Jon Peltier 😛
I thought may be the problem is interesting for fellow blog readers. So I posted it here.
Hi,
Adapting the code in the question,
[code]
Sub InsPicture()
pPath = "http://chandoo.org/images/pointy-haired-dilbert-excel-charts-tips.png"
With ActiveSheet.Pictures.Insert(pPath)
.Left = Range("a1").Left
.Top = Range("a1").Top
End With
End Sub
[/code]
Seems to work fine
Looks like it was a problem in 2007 up to SP1, which was corrected in SP2.
@Jon.. seems like the case. I just checked the version at work laptop. it is 12.0.6331.5000 (SP1).
Thank you so much every one. I really appreciate your time and suggestions in solving this.
Glad to help. I couldn't understand why something so straightforward wasn't working.
Hi All
Is there a way of inserting a motion clip eg animated gif or swf or flv?
Thks
You can insert animated GIFs by inserting them in a browser control through VBA. For other types of movies, I can guess you can insert them as clip art.
I WANT THE INSERT PICTURE BY USING COADING
so currently i was struggling same as you, chandoo, with the insert picture method in excel 2007/10 from an url and came along your thread here.
so i re-designed the code on the addshape method as mike was suggesting it and all of the sudden it works just fine.
thanks alot to you guys, you were a great help
a big salut from switzerland
Hi guys,
I need help copying and pasting an image with the path in a cell.
I leave the code.
And thank you very much!
Sub Copiarimg()
Dim pic As Picture
With ActiveSheet
Set pic = .Pictures.Insert(Range("f2").Value)
With .Range("e9:g22")
pic.Top = .Top
pic.Left = .Left
pic.Width = .Width
pic.Height = .Height
End With
End Sub
I've played around with the approaches in these comments, and the code below is what I've come up with. The ImagePath can be a local file or a URL. As Jon mentioned above, the trick is to set an arbitrary value for the width and height, then call the ScaleWidth and ScaleHeight methods afterward to reset the picture to its original size. Once the LockAspectRatio property is set, you can change the picture width and the height will automatically scale (or vice-versa).
Sub AddPictureToRange(TopLeftCellAddress As String, ImagePath As String)
Dim pic As Shape
Dim l As Single, t As Single
Dim temp As Single
l = Me.Range(TopLeftCellAddress).Left
t = Me.Range(TopLeftCellAddress).Top
temp = 10# ' arbitrary value
Set pic = Me.Shapes.AddPicture(ImagePath, msoFalse, msoTrue, l, t, temp, temp)
pic.ScaleHeight 1#, msoTrue
pic.ScaleWidth 1#, msoTrue
pic.LockAspectRatio = msoTrue
End Sub
I need some help with inserting pictures. I have an excel file with a column of item numbers next to this row I want to insert a picture of this item. The pictures are coded with the item number so I tried to insert it with one of the codes above:
Sub InsPicture()
pPath = "http://img.bricklink.com/P/80/55236.gif"
With ActiveSheet.Pictures.Insert(pPath)
End With
End Sub
That worked but I need to do that for every row separtly.
So I tried in the code
pPath = "http://img.bricklink.com/P/80/"&Text(a1;"#")&".gif"
But that gives errors.
Anybody ideas?
Hi Nicholas, I used your solution in a related problem in Excel 2003 and it worked flawlessly..thank you!
Hi Mike Alexander,
Your solution with some changes was helpful in my problem in XL 2007, thanks.
Hi,
thanks all. In addition, I had a problem with multiple pictures inserting (every new picture replaced the prior one). I've changed it a bit, may be helpful..
Sub test()
ActiveSheet.Shapes.AddShape msoShapeRectangle, 50 , 50, 100, 200
ActiveSheet.Shapes(1).Fill.UserPicture _
"http://www.datapigtechnologies.com/images/dpwithPig6.png"
ActiveSheet.Shapes(1).Copy
ActiveSheet.Paste
End Sub
Try this instead:
Sub test()
ActiveSheet.Shapes.AddShape msoShapeRectangle, 50 , 50, 100, 200
ActiveSheet.Shapes(ActiveSheet.Shapes.Count).Fill.UserPicture _
"http://www.datapigtechnologies.com/images/dpwithPig6.png"
End Sub
Thanks to everyone, this thread has been very helpful. However, image inserting still doesn't work quite as expect for me.
While I can get a picture inserted into an Excel 2010 worksheet using either:
1) ActiveSheet.Shapes(ActiveSheet.Shapes.Count).Fill.UserPicture...
2) ActiveSheet.Pictures.Insert(pPath), and
3) Shapes.AddPicture...
unfortunately the images all insert with a display size determined not by the actual pixel dimensions of the image but by the dpi resolution.
So for example, if I insert two copies of the exact same 600x600 pixel image, one with a 300dpi resolution and the other with 72dpi, they display at vastly different sizes on screen.
While this might be intended behaviour for Excel in order to maintain a WSYWIG printing layout, I actually need a way to insert the image based on the the actual pixel dimesnsions and ignoring the dpi resolution.
Any help appreciated.
Thanks
Kez
Not doing an intentional bump, but realised I posted in rely to one of the repsonses here instead of to the main thread, so reposting.
=====
Thanks to everyone, this thread has been very helpful. However, image inserting still doesn’t work quite as expected for me.
While I can get a picture inserted into an Excel 2010 worksheet using any of the below methods:
1) ActiveSheet.Shapes(ActiveSheet.Shapes.Count).Fill.UserPicture....
2) ActiveSheet.Pictures.Insert(pPath), and
3) Shapes.AddPicture....
unfortunately the images all insert with a display size determined not by the actual pixel dimensions of the image but by the dpi resolution.
So for example, if I insert two copies of the exact same 600×600 pixel image, one with a 300dpi resolution and the other with 72dpi, they display at vastly different sizes in Excel on screen.
While this might be intended behaviour for Excel in order to maintain a WYSIWYG printing layout, I actually need a way to insert the images based on the the actual pixel dimesnsions and ignoring the dpi resolution.
Any help appreciated.
Thanks
Kez
Well, answered my own question 🙂
For those who might be interested, you can use this function:
Public Function GetPicDims(strFilePath As String, strFileName As String) As String
GetPicDims = CreateObject("Shell.Application").Namespace((strFilePath)). _
ParseName(strFileName).ExtendedProperty("Dimensions")
End Function
to get the dimensions of the image you want to insert. Then you can parse the return string and use the width and height values to add a rectangle shape of the appropraite size, like:
ActiveSheet.Shapes.AddShape msoShapeRectangle 50, 50, iWidth, iHeight
which you then fill with the picture:
ActiveSheet.Shapes(ActiveSheet.Shapes.Count).Fill.UserPicture "c:\temp\test.jpg"
This way the picture gets inserted using the pixel dimensions and the (print) resolution gets ignored.
If desired, the GetPicDims function can be made more generic to get other ExtendedProperties.
Regards
Kez