
This is a guest post written by Paramdeep from Pristine. Chandoo.org is partnering with Pristine to bring an excel financial modeling online training program for you.
 This is Part 2 of 6 on Financial Modeling using Excel
In this tutorial we are going to learn how to build a financial model to do project evaluation using Excel. The 6 parts of this tutorial are,
- Introduction to Financial Modeling
- Building a layout for Project Evaluation Model – Best practices
- Building Inputs and Assumptions Sheet
- Building Projections for Project Evaluation
- Modeling the Cash Flow Statement and Projections
- Putting it all together – Final Project Evaluation Model
- Join our Financial Modeling Classes
Building a Layout for a Project Evaluation Model
If you know basic referencing and formula framework in excel, you can write a model that calculates numbers. Good vs Bad financial model would be decided by the layout of the model.
Before we start discussing on how to build a good layout, lets see the layout that I have in mind. The layout is based on my experience of working as an investment banker and as a consultant and I find it neat.
What is so awesome about this model layout?
- Structured in logical modules (Separate sections/ sheets for separate units like Assumptions, P&L, Cash, Balance Sheet, calculations and conclusion. It makes navigation and understanding very clear
- Formatting of the sheet
- Inputs different from calculations (Typically you would find inputs in blue font and calculations in black)
- No grid lines
- Numbers with similar decimal points, etc.
- Proper indenting of model with comments
- Ease of navigation in the model
Start building the model template
Follow these steps to create a simple layout to perform project evaluations.
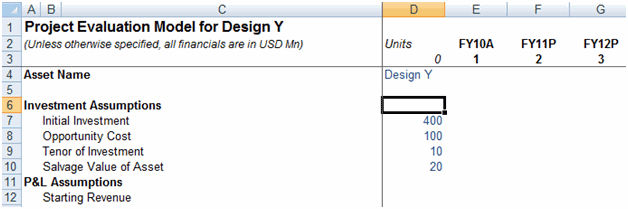
- Disable Grid lines for the sheets.
- Decrease the size of the first 2 columns and increase the size of the third column.
- Use the columns after that to set the required years.
Benefits of such a template
Since the size of columns A and B is small, if we use column A for a main heading, then we can use column B for a sub-heading. This would act as an indenting for the document (Similar to what you see in table of content in any book). This also acts as a bookmark.
Lets say, if I have 3 main headings – Assumptions, calculations and valuation, then we put them in column A and all the subheadings like, Investment assumptions, P&L Assumptions, Working Capital, Cash etc. in subheadings.
If you remember the Ctrl + arrow shortcut to navigate fast, you can use it to navigate from one section to the other in a fast manner. The columns act as a bookmark!

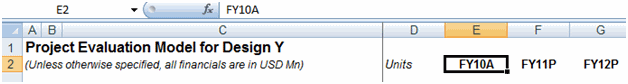
The other thing to note is the Column mapping to the year is sacrosanct. For example, in my model FY 10 is aligned to column E. Now whenever anybody wants to do any calculation for FY 10, she would remember to do it in column E. If there is any mention of FY 10 in columns different from E, it raises an alarm!!
One more trick that I generally use in the model is to freeze panes, so that I can always see for a particular year, what is the item that I am using. (tip # 12 on 15 excel tips)
Single sheet or multiple sheet model
If you are developing a mini model (Like the one we are doing here), you can use a single sheet and use the bookmarking methodology to separate the logical sections. If the information is large then one sheet might become too large. If you are using multiple sheets, then REMEMBER – always use the same template and you should maintain the matrix integrity (In our case column E corresponding to FY 10). Just copy the sheet to create other logical units. When you are using multiple sheet models, remember Ctrl + PgUp/ PgDn is your best friend to navigate across sheets.

Best Practices While Designing Models:
[added by Chandoo]
I hate to interrupt Paramdeep’s flow. But I want to list down few best practices I have seen across various models.
- Keep your formats consistent: As observed above, use one color for input cells, one color labels, one for outputs etc. Also, follow same formats for charts and all other visual elements of your model. Consistency is very important to keep your model simple and easy to maintain. (tip: use cell styles)
- Separate calculations from outputs: While simple models can have all the calculations done on output sheet, ideally you should have a separate worksheet for doing all the calculations (formulas). This will make your model elegant and simple.
- Do not hard code values, instead use “assumptions” sheet: If you need to use inflation rate of say 6%, never hard code that in to formulas like =A1*(106%)^A3, instead keep all the assumptions in a separate worksheet (call it as assumptions like above) and fetch the values from that. This will help you revise your financial model easily when your assumptions change.
- Use named ranges: Financial models can be quite complicated beings. A formula like =Assumptions!C23*(1+Calculations!A21)/Inputs!B13 can be quite confusing and useless. When you need to debug or modify your model you are totally clueless as to what these references mean. Instead define names for all important values and use them in formulas.
- Use helper columns without shame: While most of us would get a nice ego boost to write one big formula to solve all the problems, it may not be a nice thing to do in modeling. Instead split your problem in to small, meaningful chunks and use helper columns to solve it. This will make your model easy to maintain.
- Use conditional formatting to highlight relevant stuff: If you are going to demonstrate scenarios in your model, you can use conditional formatting to highlight scenarios. You can also use CF to bring key values / areas to user’s focus. (tip: become a conditional formatting rockstar)
- Use data validation: Getting invalid data in to your model can be quite frustrating. Instead of addressing invalid data thru formulas, you should try to avoid them by using data validation for input / assumption worksheets. (tip: allow only a list of values in a cell)
- Know Excel Better: Learn a few keyboard shortcuts, understand how features like tables, formulas & formatting work. This will save precious amount of time when you are busy modeling. (100s of tips on keyboard shortcuts, excel tables, formulas, charting & formatting)
Most importantly,
- Know your industry better: Nothing beats industry knowledge. Even if you know nothing about excel and modeling, you can learn them easily thru sites like chandoo.org and pristine. But industry knowledge is something that is hard to pick up. Thorough understanding of your company, your market, your customers, your products and your processes is very important to define and prepare a good model.
All the best.
Download Project Evaluation Model Layouts
I have created part templates and you can download the single sheet model and the multiple sheet model to take a look at it. I would suggest that you look at it and try to create a template of your own (Even if that means just trying to create an exactly same template).
Download zip file containing the model layouts | Download the case-study [pdf]

What Next?
In the next installment, we would see, how we can fill in the assumptions part of the model. It would mean reading through the case and filling in the assumptions part of the model. For maximum benefit from the series, please try to fill it on your own and fill in the other parts of the model as well.
Read first part of this series – Introduction to Financial Modeling
What Best Practices & Layout ideas you follow in Modeling?
We are very eager to learn from you about ideas and best practices you follow when building financial models. Please share using comments.
Join our Financial Modeling Classes
We are glad to inform that our new financial modeling & project finance modeling online class is ready for your consideration.
Please click here to learn more about the program & sign-up.
Added by Chandoo:
Thank you Paramdeep & Pristine:
Many thanks to Paramdeep and Pristine for making this happen. I am really enjoying this series and learning a lot of valuable tricks about financial modeling.
If you like this series, say thanks to Paramdeep. I am sure he can take any amount of appreciation without choking.
Join our Newsletter
If you are new here, consider joining my newsletter, because I can send you updates when new articles are posted (plus you get a cool e-book with 95 excel tips, FREE)
Pristine is an awesome training institute for CFA, PRIMA, GARP etc. They have trained folks at HSBC, BoA etc. Chandoo.org is partnering with Pristine to bring an excel financial modeling online training program for you.


17 Responses
I do like the bookmark tip, there are some cases where I will have more than two levels but that is a great standard to go by and it is easy to add additional cells for more levels.
Separate calculations from outputs, this advice is not necessarily a good idea all the time. I admit I due get myself into trouble having input and calculation cells on the same sheet. However, this is mostly due to forgetting to lock or re-lock (when making changes) to formula cells. I somehow get a sticky finger and delete or somehow change a calculation cell and I rarely know how I did it. I just know that one month is right, the next is wrong and it was due to me changing a calculation field somehow.
The reason one cannot go by this guideline often is for presentation purposes or data input reasons. It is a pain for usability to separate some data which naturally should go together. Example calculating EAC’s when updating and validating if my update projections for ETC’s are valid. I need calculation fields based on Actuals to date, EAC, monthly EAC variances, budget variances, and monthly variance to help sanitize ETC’s people give me or I update. Seconly, from a presentation standpoint this data should be on the same sheet. The time maintaining ETC’s on the separate tab which would have the exact same number of cells on the presentation sheet would just not make practical sense.
So my recommendation is once you are done creating your formulas lock the cells if you are going to have input and outputs on the same tab.
Great stuff you guys! I love the column mapping concept; a simple but very effective approach. I also really like how you have made this series interactive: letting us work with the model and case data so we can try each step on our own before showing us how you did it.
For complex models I like to build ‘alarms’ into the file along the way. These are simple IF formulas that return bright red “ALERT” text if selected data values or ranges don’t balance. You can keep them off to the side or out of sight on the bottom. I find that reviewing your data from a different direction than what you used in your model is a good practice (e.g if your model is set up so that A + B = C then test that C – B = A, etc).
You can also set up a separate worksheet that does nothing but test all of your calculations to make sure they balance and if you test each section (and subsection) of your model separately you can better isolate problems.
Good stuff!
However, I agree w Brian saying that separating assumptions from calcs is not necessarily a good idea always. I try to do it as much as possible, but when you quickly need to be able to do some basic variance analysis, it might be helpful to have model and assumptions on same page. I’ve gotten into the habit of color coding my inputs. i.e. all inputs are blue font, calcs are just black, green are references to different sheets, and pink is special manual adjustment. I also like to use if-statements in conditional formatting to set wrong cells/formulas to red font. I just have a couple of basic fontcolor macros in my personal workbook, so I can switch font colors with shortcuts. I found this makes it really easy to audit formulas.
Henk,
I have done some If statments with conditional formatting for audit purposes. However, the problem I ran into is I would have to recreate information because conditional formatting could not be based on others tabs. However, I just read the named ranges take care of this problem, so I will try to see if this works.
Again my apologies for the late reply on the comments!
@Brian, Henk: I agree, sometimes if your input data is heavy, navigating within sheets can become difficult. What I do for that is – I keep the assumptions in 1 sheet (called assumptions). If there is a need for particularly large amount of data in some other sheet (For example, if I need the revenue in P&L and it is going to take my growth assumptions for various years from assumptions sheet) I just link the assumptions in the top of revenue sheet (Just an = assumptions.revenue). This does not take too long and presentation wise its better as well.
@Josh: A very good practice to put your tests in the sheet. I use that very often for the basic sheets.
This is fantastic…
Thank you so much
DKN
Hi,
Just want to know the online classes can be download and saved in my sytem.
Pls advice.
Regards,
Arun
Hi Arun,
Yes the online classes (video tutorials) and the excel models can be downloaded and saved in your system.
i will accounting make to party bill name, address, in excel in formating
hie ppl…I jst wantd a small favour cn smone help me out in calculating EBITDA, along with its working, from wipros annual report 2011-2012, link – http://www.wipro.com/investors/annual-reports.aspx
…PLZ plz… i am having a submission tommorow.
If you send the excel sheet in the same format with historical statements put in the same, I can help you with calculating the EBITDA.
Hi all,
Has anyone done any financial modelling of cross-border real estate acquisitions? I am just battling with incorporating currency movements into my model.