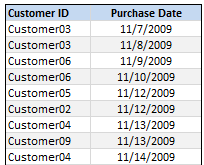
This is second part of 2 part series on conditionally formatting dates in excel.
 In yesterday’s post we have learned how to conditionally format dates using excel. In this article, you will learn how to use these conditional formatting tricks to highlight repeat customers in a list of sales records.
The problem: Highlighting repeated customers in a list
Let us say you run a small retail store. And you want to give special discounts to all the repeat customers.
Repeat customer is someone who bought at least twice from you in last 30 days. (If the person bought twice but the gap between 2 purchases is more than 30 days they are not repeat customers).
The Data:
Let us assume your sales data has these 2 columns – customer ID and purchase date. I have shown first few rows here. Let us assume the data is in the range B4:C53.

Finding if a customer is repeat – The Formula:
If we just want to highlight without considering the purchase dates,
we can use a simple formula like =COUNTIF($B4:$B53,$B3)>1 in the conditional formatting applied over the range B4:C53.
But we need to consider the date as well,
hmm, now that is tricky !??
May be time for a sip of that coffee. Go take it, I am waiting..,
How about the SUMPRODUCT? We all know that sumproduct formula can be used to test more than one condition.
The formula:
=IF(C4>TODAY()-30,IF(SUMPRODUCT(--($B$4:$B$53=B4),--($C$4:$C$53>(TODAY()-30)))>1,"R","N"),"N")
Now that is one lengthy badass formula. Like Sergeant Martin Riggs. Bad, but still cool.
So what is this formula really doing? It is going to give us “R” if a customer is repeat and “N” if not. See this explanation to understand how it works.

Note: the double dashes “–” make the values as 0s and 1s from a bunch of “trues” “falses”. To know why sumproduct is such a beautiful and robust formula look no further.
The Conditional Formatting
Now that you have figured out the formula to determine a customer is repeat or not, applying conditional formatting is a piece-o-cake.
Just select the range B4:C53, go to conditional formatting and select “formula” option. Now specify the above formula and check if its output is “R” and apply formatting.
I am not telling you how to do this. It is your homework. Go figure!
That is all. Your workbook now highlights repeat customers in the last 30 days. Remember, as you reopen the file a week later, the highlighting logic changes since the date has changed.
Download the example workbook
Click here to download the example workbook and understand how to highlight repeat customers using conditional formatting. The file works in Excel 2003+.
What is your experience?
Share your tips and ideas on using conditional formatting with dates. What are the situations you usually face and how to solve them? I am never too old for this, so please share.


One Response to “How to compare two Excel sheets using VLOOKUP? [FREE Template]”
Maybe I missed it, but this method doesn't include data from James that isn't contained in Sara's data.
I added a new sheet, and named the ranges for Sara and James.
Maybe something like:
B2: =SORT(UNIQUE(VSTACK(SaraCust, JamesCust)))
C2: =XLOOKUP(B2#,SaraCust,SaraPaid,"Missing")
D2: =XLOOKUP(B2#,JamesCust, JamesPaid,"Missing")
E2: =IF(ISERROR(C2#+D2#),"Missing",IF(C2#=D2#,"Yes","No"))
Then we can still do similar conditional formatting. But this will pull in data missing from Sara's sheet as well.