All articles with 'sports' Tag
Thank you Sachin [a small tribute]
Lets talk about people who inspire us. People who show us that anything is possible. People who prove that commitment, hard work and perseverance are true ingredients of a genius.
I am talking about Sachin Tendulkar. Those of you who never heard his name, he is the most prolific cricketer in the world. He is the leading scorer in both tests (15,921 runs) and one day matches (18,426 runs). Read more about him here.
Tendulkar has been an inspiration for me (and millions of others around the world) since I was a kid. The amount of dedication & excellence he has shown constantly motivates me. It is a pity that the great man is retiring from test cricket. He is playing his last test match (200th, most by any person) as I am writing this.
So as a small tribute, I have decided do something for him. Of course, I have never been a cricketer in my life. Once in college I was reluctantly asked to be a stand-by player in a game with seniors. I did not get a chance to pad up though. That is the closest I have been to a cricketer. So I did what I do best. Create an Excel workbook celebrating Sachin’s test career.
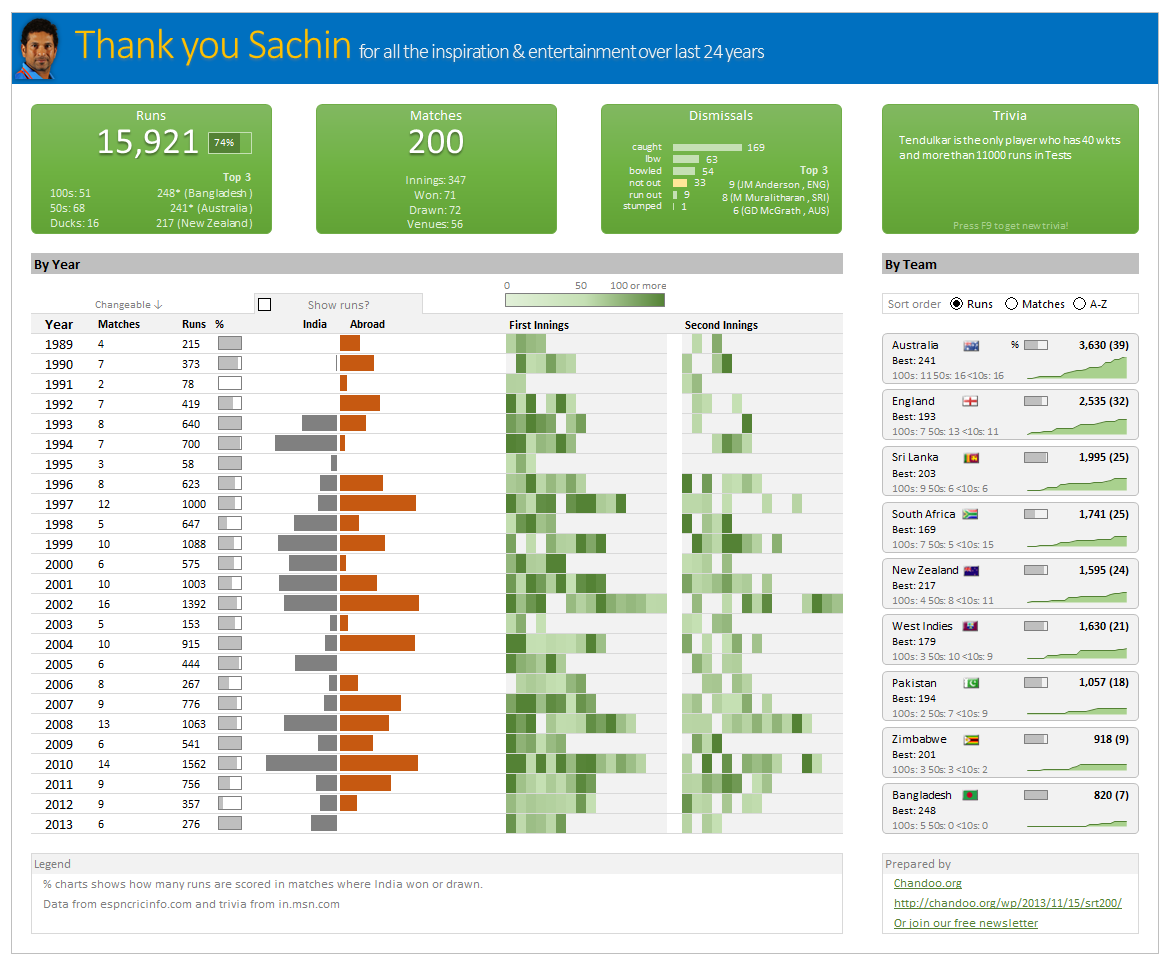
Thank you Sachin – his test career in a dashboard
Here is a dashboard I made visualizing his test cricket statistics. It is dynamic, fun & awesome (just like Sachin).
(click on the image to enlarge)
Continue »Visualizing Roger Federer’s 7th Wimbledon Win in Excel

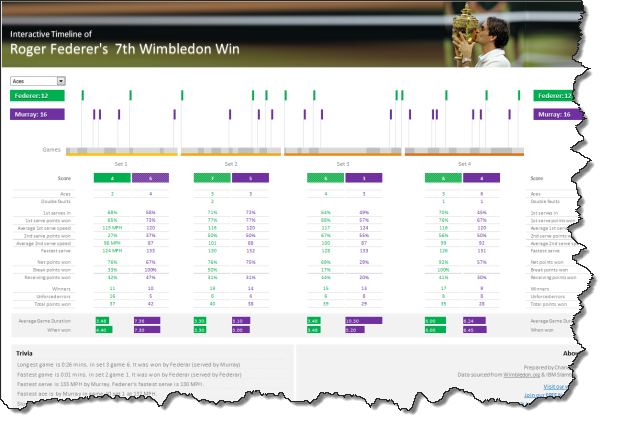
Did I tell you I love tennis? Some of my personal heroes & motivators are tennis players. And as you can guess, I admire Roger Federer. Watching him play inspires me to achieve more. So last night when he lifted Wimbledon trophy for 7th time, I wanted to celebrate the victory too, in my style. So I made an interactive timeline chart in Excel depicting his victory.
Continue »Formula 1 Style Sorting of Times (Durations) in Excel

The other day I was watching Formula 1 on TV. I think it is the ideal game to follow for a lazy dude like me. It is on every other weekend. It takes .32 seconds to understand the game and 3.2 seconds to know the points and scoring mechanism. But I am not here to convince you to follow the game. While looking at score boards, it struck me,
“how about writing excel formulas for sorting a list of durations (or numbers) in the formula 1 order?”
Continue »Sports Statistics Dashboard in Excel – Few More Alternatives

First of all, thanks everyone for making the should you always start barcharts at zero? discussion lively. Almost everyone felt that we should start bar charts at zero. After spending sometime with my initial test cricket statistics dashboard, I have created few alternatives. You can see them below. But somehow I feel that I haven’t […]
Continue »


