All articles with 'small multiples' Tag
Hello there,
My travel to US was fantastic and fun. Many thanks to Jocelyn & Rob Collie, who found a nice apartment for us and made sure we are settled down in almost no time. Weather has been excellent so far too with lots of sunshine and blue skies. We went to a nearby park the other day and kids really loved walking on trials and exploring.
Gentle reminder
Today is last day to sign-up for my USA Masterclass
Today is last day to join my USA Advanced Excel & Dashboards masterclass with early bird discount. If you live near Chicago, Washington DC or Columbus and love Chandoo.org style of teaching, then you will benefit alot from my masterclass. We have very few spots left in Chicago & Columbus. So go ahead and book yours today and save $200.
Click here to know more and join us.
Continue »{ 38 Comments }
How the tax burden has changed over the years – Excellent chart by NYTimes & Redoing it in Excel
Published on Dec 6, 2012 in Charts and Graphs
If I need some charting inspiration, I always visit New York Times. Their interactive visualizations are some of the best you can find anywhere. Clear, beautifully crafted and powerful. Long time readers of Chandoo.org knew that I like to learn from visualizations in NY Times & redo them using Excel.
Today let me present you one such chart. This is based on an interactive visualization prepared by NY Times explaining how the tax burden has changed over years for various income groups.
Take a look at tax burden chart – Excel implementation
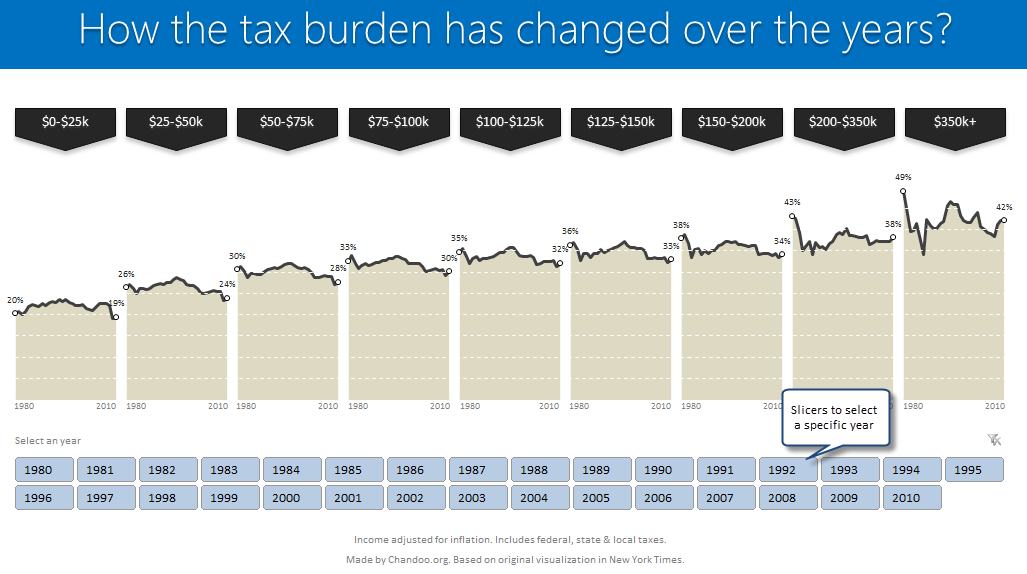
Read on to learn how to create this chart using Excel.
Continue »{ 30 Comments }
Making Small Multiples in Excel [Charting Technique]
Published on Nov 16, 2011 in Charts and Graphs
![Making Small Multiples in Excel [Charting Technique]](https://img.chandoo.org/c/final-small-multiples-chart.png)
Today, lets learn how to create small-multiples (or panel charts) to visualize trend of 2 product lines over years in various regions. The inspiration for this chart and article came from my friend, Paresh‘s recent article on his blog.
See how you can create a combination of area & line chart to create the small-multiple chart and clone it. You can also download the workbook and play with it to understand this technique better.
Continue »
