All articles with 'screencasts' Tag
Another Reason why Tables are so awesome [quick tip]
![Another Reason why Tables are so awesome [quick tip]](https://chandoo.org/img/l/excel-table-scroll-feature.png)
Ever since I have learned the tables feature in Excel 2007, I have fallen in love with that. They are so awesome and so user friendly.
Here is a simple, yet very effective feature of Excel Tables that will show table header row even when you scroll down. The header row is shown in the place of column headings (the place where you see A,B,C,D etc.).
Continue »Use Cell Styles to Make your Spreadsheet Models User-friendly [Quick Tip]
![Use Cell Styles to Make your Spreadsheet Models User-friendly [Quick Tip]](https://chandoo.org/img/i/use-excel-cell-styles.png)
Spreadsheet modeling or scenario modeling is one of the common uses of Microsoft Excel. People, especially in financial sector use MS Excel to do a lot of modeling. While excel has such powerful features like goal seek and scenarios, it also has a very useful feature called “cell styles” that you can exploit to make […]
Continue »Recipe for a Donut Bar Chart

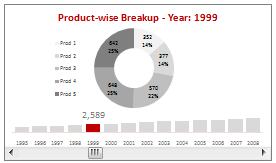
We all know that bar charts can be used to display values spread across various categories or times and pie charts / donut charts can be used to display percentage breakup of various quantities in a sum total. How about mashing up both to create a Donut Bar chart?
In this tutorial, you can learn how to make a donut bar chart and linking it to a form control to display Product-wise sales breakups spread across several years.
Continue »Dynamically Grouping Related Events [Excel Combo Charts with Pizzazz]
![Dynamically Grouping Related Events [Excel Combo Charts with Pizzazz]](https://chandoo.org/img/n/dynamic-event-grouping-charts-th.gif)
Yesterday we have posted how to use excel combo charts to group related time events. Today we will learn how to change the event grouping dynamically using form controls.
This effect can be easily achieved with a cup of coffee, one combo box form control and the good old IF formula. Read more to learn how to do this.
Continue »In today’s installment of project management using excel, we will learn about project tracking tool – to-do lists. Projects are nothing but a group of people getting together and achieving an objective – like building system or constructing a bridge. While it is important to have a overall project plan and vision, it is equally important to understand how various day to day project activities are going on. This is where to do lists can help you a lot. Read on…
Continue »It is very surprising that so many of us are still not aware of this extremely powerful tool in Excel 2007. Just with a click of the button, you can remove all the duplicate values from a list / table. To remove duplicates, (1) Just select the list of values from which you want to remove duplicates (2) Go to Data ribbon (3) Hit the Remove Duplicates button (4) Bingo…
Continue »![Gantt Charts – Project Management Using Excel [Part 1 of 6]](https://chandoo.org/img/pm/gantt-chart-project-plan-thumb.png)
This is a 6 part tutorial on project management using microsoft excel. These posts represent few of the things related to project management using excel that I have learned over the years. The first installment deals with Preparing & tracking a project plan using Gantt Charts in MS Excel.
The other parts I am planning are, Day to day operations – using to do lists, Preparing a project time line, Time sheets and Resource management, Tracking issues and risks, Project Status Reporting – Dashboard.
Read the first part of the article to learn how to make excel gantt charts / project plans.
Continue »Statistical Distributions in Excel [spreadcheats]
![Statistical Distributions in Excel [spreadcheats]](https://chandoo.org/img/n/frequency-excel-formula.png)
Excel has very powerful formulas and add-ins for performing almost any kind of statistical analysis. Today we will learn how you can make a statistical distribution of test scores using excel. There is a downloadable workbook too, for you to take a look at the formulas and play with them.
Continue »

