All articles with 'overlapped charts' Tag
{ 5 Comments }
How-to highlight maximum value in Excel charts? [Quick tip]
Published on Aug 7, 2019 in Charts and Graphs
![How-to highlight maximum value in Excel charts? [Quick tip]](https://chandoo.org/wp/wp-content/uploads/2019/08/highlight-maximum-value-in-excel-charts-m.png)
Ever wanted to highlight maximum value in charts? Then this tip is for you.
Continue »{ 39 Comments }
Make a Quick Thermometer Chart to Compare Targets and Actuals
Published on Dec 17, 2009 in Charts and Graphs
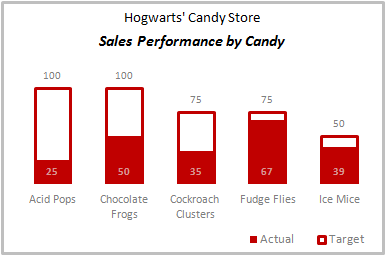
Comparing values is one of the reasons why we make charts. So today I am going to teach you a handy little trick to make a thermometer like chart to compare targets with actuals. This type of chart is very useful when you have a bunch of sales targets and you want to measure how the performance has been.
Continue »
