All articles with 'OFFSET()' Tag
Making a chart with dynamic range of values

We all know that to make a chart we must specify a range of values as input.
But what if our range is dynamic and keeps on growing or shrinking. You cant edit the chart input data ranges every time you add a row. Wouldn’t it be cool if the ranges were dynamic and charts get updated automatically when you add (or remove) rows?
Well, you can do it very easily using excel formulas and named ranges. It costs just $1 per each change. 😉
Ofcourse not, there are 2 ways to do this. One is to use Excel Tables and another is to use OFFSET formula.
Continue »It is no exaggeration that knowing excel formulas can give you a career boost. From someone starting at the long list of numbers, you can suddenly become a data god who can lookup, manipulate and analyze any spreadsheet.
So when our little excel blog hit the 5000 RSS Subscriber milestone, I celebrated the occasion by asking you to share an excel formula through twitter or comments with rest of us. And boy, what an excellent list of formula tips you have shared with us all.
Here is the complete list of entries for the twitter formula contest.
Use ROWS() and COLUMNS() formulas to generate numbers in a sequence [quick tip]
Here is a quick excel formula tip to start your week. Use ROWS() and COLUMNS() formulas next time you need sequential numbers. What does ROWS() excel formula do? ROWS excel formula takes a range as an argument and tells you how many rows are there in that range. For. eg. ROWS(A1:A10) gives 10. How can you […]
Continue »
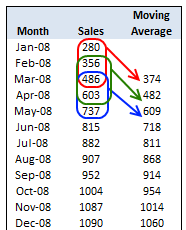
As part of our spreadcheats, today we will learn how to calculate moving average using excel formulas. As a bonus, you will also learn how to calculate moving average of latest 3 months alone using the count, average and offset formulas. Once you finish the tutorial, you have some home work to do as well. So go ahead and learn how to calculate moving averages.
Continue »Visualizing Search Terms on Travel Sites – Excel Dashboard

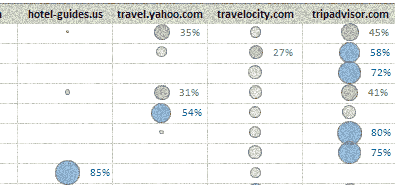
Microsoft excel bubble chart based Visualization to understand how various travel sites compete search terms
Continue »Advanced Data Validation Techniques in Excel [spreadcheats]
![Advanced Data Validation Techniques in Excel [spreadcheats]](https://chandoo.org/wp/wp-content/uploads/2008/11/data-validation-change-lists.png)
Data validation is a great way to keep your users informed about possible values in a cell and guide them to select something appropriate. As part of the spreadcheats series, in this post we will discuss 2 advanced data validation techniques that can help you when you are modeling a complex worksheet.
Continue »Make your VBA macros work anywhere: Enable Relative References

Do you know that while recording macros in excel you can use the relative reference based recording so that you can use your macro anywhere and the references would be adjusted automatically? Yes! I have learned this yesterday and I thought it is pretty cool. Here is how you can make your macro VBA code […]
Continue »Creating KPI Dashboards in Microsoft Excel is a series of 6 posts by Robert from Munich, Germany. This 6 Part Tutorial on KPI Dashboards Teaches YOU: Creating a Scrollable List View in Dashboard Add Ability to Sort on Any KPI to the Dashboard Highlight KPIs Based on Percentile Add Microcharts to KPI Dashboards Compare 2 […]
Continue »![Creating KPI Dashboards in Microsoft Excel [Part 1 of 6]](https://chandoo.org/wp/wp-content/uploads/2008/08/kpi-dashboard-scroll-excel-thumb.png)
Creating KPI Dashboards in Microsoft Excel is a series of 6 posts by Robert. This 6 Part Tutorial on KPI Dashboards Teaches YOU: Creating a Scrollable List View in Dashboard Add Ability to Sort on Any KPI to the Dashboard Highlight KPIs Based on Percentile Add Microcharts to KPI Dashboards Compare 2 KPIs in the […]
Continue »

