All articles with 'form controls' Tag
Do you know these Excel 2007 Productivity Secrets (Hint: Coffee is not one of them)

Do you know these excel 2007 productivity secrets? (1) How to turn on the clipboard pane so that you can do rapid copy pasting (2) How to lock a feature for repeated use (3) How to copy charts as pictures (4) How to features not on ribbon to the quick access tool bar (5) How to change the default file save settings so that excel always save files in earlier version and much more. Go ahead and read the secrets and become excel guru.
Continue »
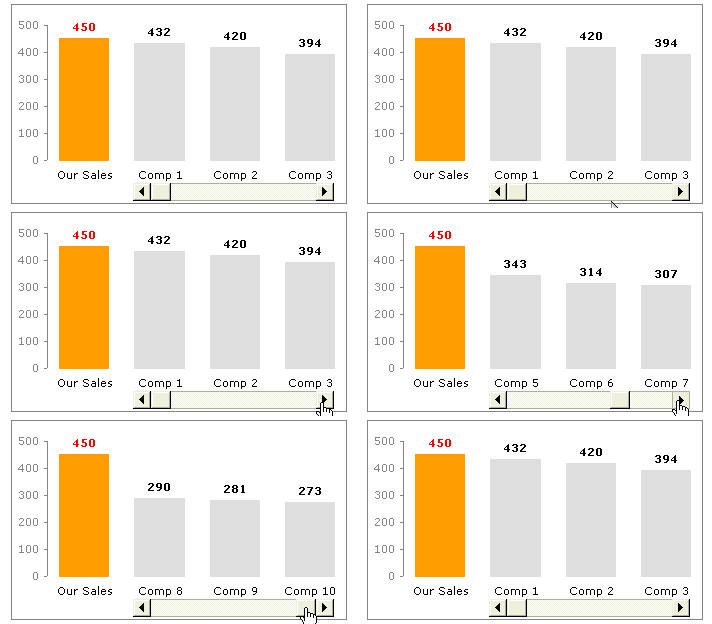
Today we will learn a little trick to compare 1 value with a set of values, For eg. our sales vs. competitor sales. We will learn how to create a chart like this.
Continue »![KPI Dashboards – Compare 2 Decision Parameters [Part 5 of 6]](https://chandoo.org/wp/wp-content/uploads/2008/10/excel-dashboard-visualization-tips-thumb.png)
This is a Guest Post by Robert on Visualization Techniques for KPI Dashboards using Excel. This 6 Part Tutorial on Management Dashboards Teaches YOU: Creating a Scrollable List View in Dashboard Add Ability to Sort on Any KPI to the Dashboard Highlight KPIs Based on Percentile Add Microcharts to KPI Dashboards Compare 2 KPIs in […]
Continue »![Creating KPI Dashboards in Microsoft Excel [Part 1 of 6]](https://chandoo.org/wp/wp-content/uploads/2008/08/kpi-dashboard-scroll-excel-thumb.png)
Creating KPI Dashboards in Microsoft Excel is a series of 6 posts by Robert. This 6 Part Tutorial on KPI Dashboards Teaches YOU: Creating a Scrollable List View in Dashboard Add Ability to Sort on Any KPI to the Dashboard Highlight KPIs Based on Percentile Add Microcharts to KPI Dashboards Compare 2 KPIs in the […]
Continue »

