All articles with 'downloads' Tag
{ 31 Comments }
Excel Check Boxes, Even Simpler Way
Published on Sep 15, 2009 in Excel Howtos, Learn Excel

In how to get tickmarks in excel, Jon commented,
“[…] Better yet, use real checkboxes, so the user can change them with the mouse.”
That got me thinking,
In excel, you can add a checkbox to spreadsheet using developer tools. But what if you need a whole bunch of checkboxes, one in each cell?
Continue »{ 31 Comments }
Issue Trackers & Risk Management using Excel [Project Management using Excel – Part 5 of 6]
Tracking issues and risks is where most of the project management time goes. Once the project planning and organizing activities are in good shape, most of the project management activities are around risk management and issue tracking. In this installment of project management using excel, we will learn how to create a simple issue tracker template using excel and how to analyze issues using excel.
Continue »{ 26 Comments }
Dynamically Grouping Related Events [Excel Combo Charts with Pizzazz]
Published on Aug 27, 2009 in Charts and Graphs
![Dynamically Grouping Related Events [Excel Combo Charts with Pizzazz]](https://chandoo.org/img/n/dynamic-event-grouping-charts-th.gif)
Yesterday we have posted how to use excel combo charts to group related time events. Today we will learn how to change the event grouping dynamically using form controls.
This effect can be easily achieved with a cup of coffee, one combo box form control and the good old IF formula. Read more to learn how to do this.
Continue »{ 10 Comments }
Using Combo Charts to Group Related Time Events [Charting Goodness]
Published on Aug 26, 2009 in Charts and Graphs
![Using Combo Charts to Group Related Time Events [Charting Goodness]](https://chandoo.org/wp/wp-content/uploads/2009/08/excel-combo-chart-th.png)
In his latest book, Now You See It, on pages 165 and 166 of the book, Stephen Few discusses how grouping related time intervals can facilitate analysis of data. As an illustration he explains that when viewing data of daily website visits, it helps in separating weekdays and weekends to differentiate expected traffic during these periods. The use of this technique would make it easier for the analyst to identify any anomalous movement in ether the weekend or the week day.
Fortunately excel combo charts can help you do that. In this guest post, Paresh explains to us how to do this.
Continue »{ 9 Comments }
50 Best Cities for Finding a Job [Incell Dashboard using Excel]
Published on Aug 20, 2009 in Charts and Graphs, Learn Excel
![50 Best Cities for Finding a Job [Incell Dashboard using Excel]](https://chandoo.org/wp/wp-content/uploads/2009/08/incell-comparison-charts.png)
We all know that incell charts are a very cool way to explore and visualize data. Personally I like them so much that I have written several tutorials on it here. Today we will see how a Job dashboard on “50 best cities for finding a job” originally prepared by Indeed job search engine can be recreated in Excel using In-cell charts. The final outcome is something like this.
Continue »{ 106 Comments }
Waterfall Charts using Excel
Published on Aug 10, 2009 in Charts and Graphs, Featured

Learn how to create waterfall charts in Excel in this tutorial. Our guest author, Aaron, explains how to create cool looking waterfall charts with connectors. Waterfall charts are great, especially for visually showing the contribution of parts to a whole.
Continue »{ 33 Comments }
Excel Time Sheets and Resource Management [Project Management using Excel – Part 4 of 6]
![Excel Time Sheets and Resource Management [Project Management using Excel – Part 4 of 6]](https://chandoo.org/img/pm/timesheets-excel-templates.gif)
Timesheets are like TPS reports of any project. Team members think of them as an annoying activity. For managers, timesheets are a vital component to understand how team is working and where the effort is going. By using Microsoft Excel capabilities you can create a truly remarkable timesheet tracking tool.
In this installment of project management using excel series, we will learn 3 things about timesheets and resource management using Excel
1. How to setup a simple timesheet template in excel?
2. How to make a more robust timesheet tracker tool in Excel?
3. How to use the timesheet data to make a resource loading chart?
{ 28 Comments }
Use burn down Charts in your project management reports [bonus post]
Published on Jul 21, 2009 in Charts and Graphs
![Use burn down Charts in your project management reports [bonus post]](https://chandoo.org/img/pm/burn-down-chart.png)
A burn down chart is a good way to understand the progress of a project. It is like a run chart that describes work left to do versus time. In this tutorial we will learn how to make a burn down chart using excel. This is a bonus installment to the project management using excel series.
Continue »{ 17 Comments }
Generating invoice numbers using excel [reader questions]
Published on Jul 20, 2009 in Excel Howtos, Learn Excel
![Generating invoice numbers using excel [reader questions]](https://chandoo.org/img/l/invoice-numbers.gif)
Learn how to generate invoice numbers, tax codes etc. using Microsoft Excel. In this example we will take a real life example shared by Michelle and findout how we can generate invoice numbers using excel formulas. Read more to learn and download the example workbook.
Continue »{ 19 Comments }
Make an Impressive Product Catalog [spreadsheets for small business]
Published on Jul 13, 2009 in excel apps, Learn Excel
![Make an Impressive Product Catalog [spreadsheets for small business]](https://chandoo.org/img/l/product-catalog-small-business-spreadsheet.gif)
It is the customer on the phone again, she wants to know what products we have.
How cool would it be if we can send her a spreadsheet with all the products neatly listed in a table and she can use filters to find what she likes. Alas, we end up sending a biggish PDF brochure that is both difficult to make and maintain.
Well, not any more.
Today we will learn a very useful and fun trick in Excel. We will create a product catalog using Excel that you can send to your clients or boss (and impress them).
Continue »![Project Management: Show Milestones in a Timeline [Part 3 of 6]](https://chandoo.org/img/pm/project-timeline-chart-excel-th.png)
Learn how to create a timeline chart in excel to display the progress of your project. Timelines are a good way to communicate about the project status to new team members and stake holders. Also, download the excel timeline chart template and make your own timeline charts.
Continue »In today’s installment of project management using excel, we will learn about project tracking tool – to-do lists. Projects are nothing but a group of people getting together and achieving an objective – like building system or constructing a bridge. While it is important to have a overall project plan and vision, it is equally important to understand how various day to day project activities are going on. This is where to do lists can help you a lot. Read on…
Continue »![Gantt Charts – Project Management Using Excel [Part 1 of 6]](https://chandoo.org/img/pm/gantt-chart-project-plan-thumb.png)
This is a 6 part tutorial on project management using microsoft excel. These posts represent few of the things related to project management using excel that I have learned over the years. The first installment deals with Preparing & tracking a project plan using Gantt Charts in MS Excel.
The other parts I am planning are, Day to day operations – using to do lists, Preparing a project time line, Time sheets and Resource management, Tracking issues and risks, Project Status Reporting – Dashboard.
Read the first part of the article to learn how to make excel gantt charts / project plans.
Continue »{ 21 Comments }
Incell Dot Plots in Microsoft Excel
Published on Jun 10, 2009 in Charts and Graphs, Learn Excel

Dot plots are a very popular and effective charts. According to wikipedia “Dot plots are one of the simplest plots available, and are suitable for small to moderate sized data sets. They are useful for highlighting clusters and gaps, as well as outliers.”
Today we will learn about creating in-cell dot plots using excel. We will see how we can create a dot plot using 3 data series of some fictitious data.
Continue »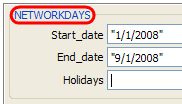
We all know that networkdays() an extremely powerful and simple excel formula can help you calculate no. of working days between 2 given dates.
But there is one problem with it. It assumes 5 day workweek starting with Monday to Friday. Not all countries have workweek from Monday to Friday.
This got me thinking and I ended up writing a user defined formula (UDF) to calculate working days between 2 given dates with any criteria. This will be good for calculating payrolls for temporary workers, offshore partners and of course people working countries where Saturday or Sunday or not usually holidays.
Continue »
