All articles with 'dashboards' Tag
![KPI Dashboards – Highlight KPIs Based on Percentile [Part 3 or 6]](https://chandoo.org/wp/wp-content/uploads/2008/09/kpi-dashboard-3-thumb.jpg)
Creating KPI Dashboards in Microsoft Excel is a series of 6 posts by Robert from Munich, Germany. This 6 Part Tutorial on KPI Dashboards Teaches YOU: Creating a Scrollable List View in Dashboard Add Ability to Sort on Any KPI to the Dashboard Highlight KPIs Based on Percentile Add Microcharts to KPI Dashboards Compare 2 […]
Continue »Creating KPI Dashboards in Microsoft Excel is a series of 6 posts by Robert from Munich, Germany. This 6 Part Tutorial on KPI Dashboards Teaches YOU: Creating a Scrollable List View in Dashboard Add Ability to Sort on Any KPI to the Dashboard Highlight KPIs Based on Percentile Add Microcharts to KPI Dashboards Compare 2 […]
Continue »![Creating KPI Dashboards in Microsoft Excel [Part 1 of 6]](https://chandoo.org/wp/wp-content/uploads/2008/08/kpi-dashboard-scroll-excel-thumb.png)
Creating KPI Dashboards in Microsoft Excel is a series of 6 posts by Robert. This 6 Part Tutorial on KPI Dashboards Teaches YOU: Creating a Scrollable List View in Dashboard Add Ability to Sort on Any KPI to the Dashboard Highlight KPIs Based on Percentile Add Microcharts to KPI Dashboards Compare 2 KPIs in the […]
Continue »Dashboarding Fun – Display Smileys in your excel dashboards
Dashboards are daily staple for some of us who need to report status to our bosses, present them in weekly meetings or generally CC half the world with what is up on our end. There are several ways in which you can spice up the dashboard, one of the simple things to do is, to […]
Continue »Excel Bullet Graphs

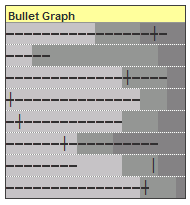
Bullet graphs provide an effective way to dashboard target vs. actual performance data, the bread and butter of corporate analytics. Howmuchever effective they are, the sad truth is there is no one easy way to do them in excel. I have prepared a short tutorial that can make you a dashboard ninja without writing extensive […]
Continue »

