All articles with 'advance' Tag
{ 49 Comments }
Introduction to Slicers – What are they, how to use them, tips, advanced techniques & interactive reports using Excel Slicers
Published on Jun 24, 2015 in Learn Excel, Pivot Tables & Charts
Slicers are one of my favorite feature in Excel. And here is a quick demo to show why they are my favorite.
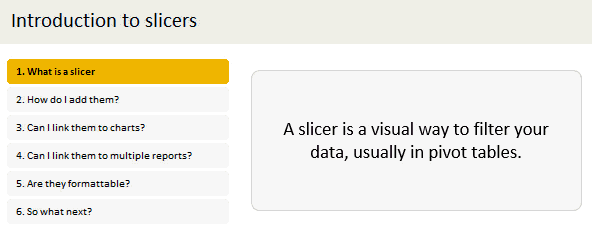
Slicers – what are they?
Slicers are visual filters. Using a slicer, you can filter your data (or pivot table, pivot chart) by clicking on the type of data you want.
For example, let’s say you are looking at sales by customer profession in a pivot report. And you want to see how the sales are for a particular region. There are 2 options for you do drill down to an individual region level.
- Add region as report filter and filter for the region you want.
- Add a slicer on region and click on the region you want.
With a report filter (or any other filter), you will have to click several times to pick one store. With slicers, it is a matter of simple click.
Read more to learn all about slicers
Continue »
