
In 2005, fresh out of MBA School, I was put on managing an e-business transformation strategy project. It was then that realized that project management was a full time job (I always wondered before that why PMs were even paid a dime!). We created huge Project Management reports for the client, where were tracked and […]
Continue »{ 31 Comments }
Filter values where Fruit=Banana OR Sales>70. In Other Words, How to use Advanced Filters?
Filtering is a simple yet powerful way to analyze data. When you apply filters to any list of values, Excel gives you some really useful pre-defined filters so that you can analyze the data in a variety of ways. So, assuming you have data like this: We all know how to filter data for Bananas. […]
Continue »Offset() function to Calculate IRR for Dynamic Range When you start the project can you be sure, for how long will you operate it? A VC gives you funds to buy a commercial project. You are to operate the project for some time and then sell it off! Can you tell me today, when you […]
Continue »Hi All. I am about to head off on holidays for a couple of weeks during which time I will only have limited internet access and won’t be helping out here at Chandoo.org or at the ExcelHero Academy whilst away. I thought I may leave a few words and a Challenge for everyone. History In […]
Continue »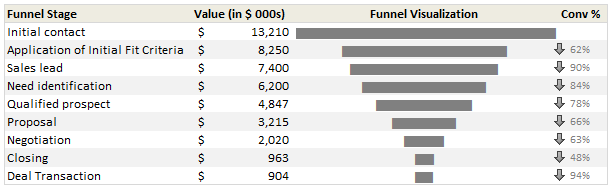
Sales Funnel or Sales Process refers to a systematic approach to selling a product or service. [more on sales process] Whether you run a small business or part of a large corporation, chances are, you heard about Sale Funnel. Understanding & analyzing your sales performance from a Funnel point of view is a great way […]
Continue »![Sum of Values Between 2 Dates [Excel Formulas]](https://chandoo.org/img/f/sum-of-values-between-2-dates.png)
Lets just say, you run a nice little orange shop called, “Joe’s Awesome Oranges“. And being an Excel buff, you record the daily sales in to a workbook, in this format. After recording the sales for a couple of months, you got a refreshing idea, why not analyze the sales between any given 2 dates? […]
Continue »![Analyzing Performance of Stocks using Excel [Example]](https://chandoo.org/wp/wp-content/uploads/2011/09/stock-analysis-in-excel.png)
Last week, we learned how to visualize Suicides vs. Murders data using Interactive charts in Excel. William, one of our readers, took this technique and applied it to Stocks. He emailed me because he has some formula issues with the stock data. Once I solved the problem, I asked him, “Can I share this with […]
Continue »
