Dot plots are a very popular and effective charts. According to dot plots wikipedia article,
Dot plots are one of the simplest plots available, and are suitable for small to moderate sized data sets. They are useful for highlighting clusters and gaps, as well as outliers. Their other advantage is the conservation of numerical information.
Today we will learn about creating in-cell dot plots using excel. We will see how we can create a dot plot using 3 data series of some fictitious data. We will create something like this:

Note: If you are new to in-cell charting, I suggest you read the incell bar charts article to understand the concept.
1. Take your data and massage it a bit
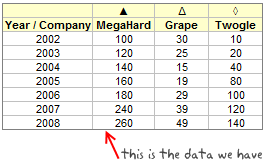
Since we are doing an incell variation of dot plot, we need to pre-process the data a little bit. Assuming we have data on revenues of 3 imaginary companies – MegaHard, Grape and Twogle like this:

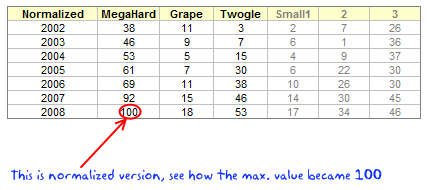
We need to normalize the data to some meaningful number like 100 (remember, incell graphs print some character for each unit in the data.) so that the in-cell dot plot looks meaningful.
After normalizing the data we will also need to calculate some helper columns so that we can develop the incell dot plot easily. The helper columns (3 of them) will show,
- Smallest value in each row – 1
- Next smallest value in each row – previous helper column – 2
- The largest value in each row – previous two helper columns – 3

Helper columns ?!? why are we doing this?
The helper columns (or intermediate values) are usual practice when we need to pre-process data for dashboards or charts. Once the chart is ready, I usually hide the helper columns as they do not really say anything.
In our case, we are using helper columns since the formulas for plotting the incell dot plot are rather long and we would make then even longer if we don’t use these.
2. Identify Symbols for Each Data Series
This is the simple job. In our case I have shown the symbols we are going to use in the above image. You can find some interesting symbols like triangles, rectangles, circles etc. in a regular font like Arial. Just go to Menu > Insert > Symbol (or Insert > Symbol in Ribbon) to find the symbols you like.
Let us assume the symbols are in the range C5:E5
3. Finally Write the Formulas That Generate the In-cell Dot Plot
Now comes the fun part. We have the normalized data in the range C16:E16, and the helper values in F16, G16, H16.
For the first row of the dot plot, the formula looks like:
=REPT("-",F16)&INDEX($C$5:$E$5,MATCH(SMALL(C16:E16,1),C16:E16,0))&REPT("-",G16)&INDEX($C$5:$E$5,MATCH(SMALL(C16:E16,2),C16:E16,0))&REPT("-",H16)&INDEX($C$5:$E$5,MATCH(SMALL(C16:E16,3),C16:E16,0))&REPT("-",100-MAX(C16:E16))
huh! it has to be one of the longest formulas I have written in a while.
I thought long and hard about how this formula can be explained and came up with the below illustration.

Once you have the formula for one row, we just need to copy paste it over the entire range to show dot plot for each year of the data. That simple!
Some formula help if you are stuck – REPT() | SMALL() | MATCH() | MAX()
How to Generate 2 Series Dot Plots?
The 2 series dot plots have even simpler formulas. So I am leaving it to your imagination. But when you finish it, the dot plot looks something like this:

Download the In-cell Dot Plot Template and Make your own Dot plots
The downloadable workbook has examples for 2 series and 3 series in-cell dot plots. Go ahead and play with it.
Further Resources on Dot Plots
Dot plots are not new, there is quite a bit of material and tools available for you to understand and make dot plots. They are proven to be very effective tools for communicating small to medium series of data. I suggest you to read few of these articles to learn more about dot plots.
Naomi’s Article on B-eye Network on Dot Plots
Excel Dot Plots using Bar Charts by Jon Peltier (Also try Excel Dot Plotter Add-in)
Excel User on Dot plots and why they are better
More on In-cell Charts
Incell Bar | Sparklines | Pie charts | Bullet Graphs | w/ Conditional Formatting


13 Responses to “Convert fractional Excel time to hours & minutes [Quick tip]”
Hi Purna..
Again a great tip.. Its a great way to convert Fractional Time..
By the way.. Excel has two great and rarely used formula..
=DOLLARFR(7.8,60) and =DOLLARDE(7.48,60)
basically US Account person uses those to convert some currency denomination.. and we can use it to convert Year(i.e 3.11 Year = 3 year 11 month) and Week(6.5 week = 6 week 5 days), in the same manner...
This doesn't work for me. When applying the custom format of [h]:mm to 7.8 I get 187:12
Any ideas why?
@Jason
7.8 in Excel talk means 7.8 days
=7.8*24
=187.2 Hrs
=187 Hrs 12 Mins
If you follow Chandoo's instructions you will see that he divides the 7.8 by 24 to get it to a fraction of a day
Simple, assuming the fractional time is in cell A1,
Use below steps to convert it to hours & minutes:
1. In the target cell, write =A1/24
2. Select the target cell and press CTRL+1 to format it (you can also right click and select format cells)
3. Select Custom from “Number” tab and enter the code [h]:mm
4. Done!
Hi, sorry to point this out but Column C Header is misspelt 'Hours Palyed'
good one
So how do I go the other way and get hours and minutes to fractional time?
If you have 7.5 in cell A1,
- Use int(A1) to get the hours.
- Use mod(A1,1)*60 to get minutes.
If you have 7:30 (formatted as time) in A1
- Use hours(a1) to get hours
- Use minutes(a1) to get minutes.
I had the same issue. You can solve it by changing the format as described above:
Right click cell > Format Cells > (In Number tab) > Custom > Then enter the code [h]:mm
([hh]:mm and [hhh]:mm are nice too if you want to show leading zeros)
Thanks guys, these are the tips I'm looking for.
...dividing the number of minutes elapsed by the percent change is my task - "int" is the key this time
It doesnt work for greater than 24 hours
It returns 1:30 for 25.5 hours. It should have returned 25:30
Ideally I would right function as
=QUOTIENT(A1,1)&":"&MOD(A1,1)*60
Sorry, replied to wrong comment....
----
I had the same issue. You can solve it by changing the format as described above:
Right click cell > Format Cells > (In Number tab) > Custom > Then enter the code [h]:mm
([hh]:mm and [hhh]:mm are nice too if you want to show leading zeros)
Clever use of MOD here to extract the decimal part of a number. Divide a number containing a decimal by 1 and return the remainder. Humm. Very clever.
Thanks very much, extremely useful !