
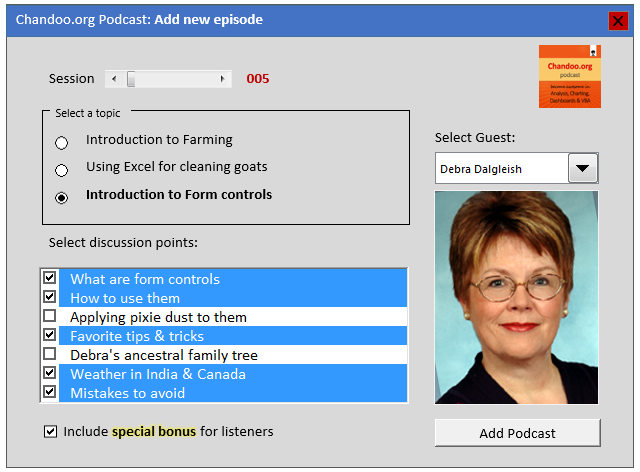
In the 5th session of Chandoo.org podcast, we are going to demystify form controls.
I am very happy and excited to interview my good friend, fellow Excel MVP, author, blogger and virtual mentor – Debra Dalgleish about this topic.
Before we proceed in to the session, let me remind you:
Get new episodes automatically!
That is right. Chandoo.org uses latest & most magical software. That means, whenever a podcast goes live, an army of magical fairies carry the sound-waves and bring them right to your mobile phone or tablet. And all you have to do is subscribe.
- For iPhone or iPod or iPad: Click here to subscribe.
- Andriod Phones & Tabs: Click here to subscribe on Stitcher. (You can download Stitcher free app from that link)
- Windows Phone: For Windows phone, search your podcasts app for our show.
- Or… As always, you can get latest episodes, show notes & resources from our Podcast page.
What is in this session?
In this session we are going to explore form controls, a powerful feature of Excel that makes your workbooks interactive. Debra is a world famous expert on all topics of Excel (especially data validation, pivot tables & form controls) and this session is very entertaining, informative and practical.
In this podcast Debra mentions about her User forms training kit. I highly recommend this product for anyone hoping to learn user forms, data entry forms and form controls. As our podcast listener, if you choose to purchase this training kit, you get
- 20% discount on Debra’s User Form Training kit (if you buy before April 30th, 2014)
- Special bonus from me: 14 page guide & practice workbook on form controls
Listen to the podcast to know how to get these.
In this podcast, you will learn,
- What are form controls
- When you would use them?
- Example form control – Combo box
- How form controls differ from active-x controls
- How to enable form controls in your Excel?
- Various important form controls
- Combo box
- Command Button
- Radio Button
- Check box
- Scroll bar & Spin button
- List box
- Compatibility of form controls between various version of Excel
- Comparison of form controls with other types of interactive features in Excel
- Slicers
- Hyper links
- VBA
- Debra’s favorite form control tip
- Special bonus & how to obtain it
Go ahead and listen to the show
Podcast: Play in new window | Download
Subscribe: Apple Podcasts | Spotify | RSS
Links & Resources mentioned in this session:
Debra’s website – Contextures.com
Books mentioned:
Courses mentioned:
- Excel School online training program
- VBA Classes online training program
- Debra’s User forms training kit
Articles & Discussion on Form controls
- Enabling Developer Toolbar & Form controls in Excel
- Multiple Selection thru Data validation
- Dependent Data Validation (Cascading Data Validation)
- Dependent Data Validation [contextures.com]
- Multi-selection list boxes – how to use them?
Other types of interactive features in Excel
- Introduction to hyperlinks
- Slicers – how to use them – case study
- Making your dashboards & reports interactive – detailed guide
Recommended Resource – Debra’s User Form Training Kit
If you wish to learn more about user forms, form controls and how they can simplify life for your workbook users, then please consider purchasing Debra’s User Form training kit. It is an eBook + Excel workbook combo that works very well and helps you understand these advanced concepts very easily.
Note: You get 20% discount on this if you buy before 30th of April. Listen to podcast for details.
Note about links: The links to various books & Debra’s training kit are affiliate links. It means when you click on them & purchase, Chandoo.org receives some commission. I recommend these books because I genuinely love them. I would have recommended even if there is no benefit to me.
Transcript of this session:
Download this podcast transcript [PDF]
If you enjoy the podcast…,
Please do these 2 things. It means a lot me & our community.
- Subscribe to our podcast on iTunes
- Please leave an honest review on iTunes by clicking here.. It will help the show & its rankings immensely. Thank you so much.
Do you use form controls?
I use them in almost all my dashboards. They are really easy to set up and use. I also love slicers, hyperlinks, little bit of VBA and any other type of interactive features Excel supports.
What about you? Do you use form controls? What is your experience like? Please share using comments.


8 Responses to “CP005: Introduction to Form Controls – an interview with Debra Dalgleish”
[…] for a friendly, and informative, discussion. And you'll be able to hear what we said -- Chandoo has posted a recording in the next episode of his Excel […]
Hi!
I listened your podcast. Thanks a lot to you and Debra Dalgleish for bringing us such a good podcast.
I purchased Debra’s User Form Training kit via your discount code.
I got everything except the "14 page guide & practice workbook on form controls" from you. Could you please help how to get your bonus guide & practice workbook.
@Samtheman... thanks for your feedback. I am glad you like this episode.
Debra will be sending the bonus files to you in next 2 days.
Excellent interview! And thanks so much for being so detailed about ActiveX controls. Some people treat ActiveX like it's a disease. From your discussion I get that you just have to pick your spots while being aware of the weaknesses.
Hi Chandoo,
Very good interview and content. Exactly how a podcast should be. Keep up the interviews formats!
The only suggestion that I have is split it in 2 parts of 30 minutes or so each.
Reasons:
- Easier for the public to find the time to list to it.
- You spend a lot of time an energy to prepare for the podcast, so you can use the content for 2 sessions instead of 1. It buys you more time to prepare for the next podcast.
Thanks,
Pablo
I agree with Pablo... excellent interview, but too long to listen to it in one go.
I finally decided to sit up late in the night and listen to it without a break 🙂
A split interview of 2 or 3 parts would be much better for the listeners as well as for the 'podcaster' 🙂
Hello, I have just bought the form controls kit but did not get the “14 page guide & practice workbook on form controls”. Could this be emailed to me? Many thanks
Simon
Hi,
We have just found your site and purchased your book, we would like to purchase Debras book, has the offer been extended to now for us to also get 20% discount and the 14 page guide & practice workbook on form controls” from you, if you could let us know as soon as possible.
an 89 page written lesson guide (PDF format), with video tutorials and demos
2 step by step projects, and completed workbooks, and starting files
5 bonus workbooks with advanced UserForm samples
User Guide and demo videos for the bonus files
20% discount on Debra’s User Form Training kit (if you buy before April 30th, 2014)
Best regards
Tom Jones