
Two weeks back I ran a poll asking you to tell me what is the last visible cell in your excel window. It was a casual poll. So I didnt expect a lot of responses. But, boy I was wrong! 295 of you have responded at last count. This is so much more than what I expected.
As I said, the purpose of this poll is to make a visualization out of the poll responses.
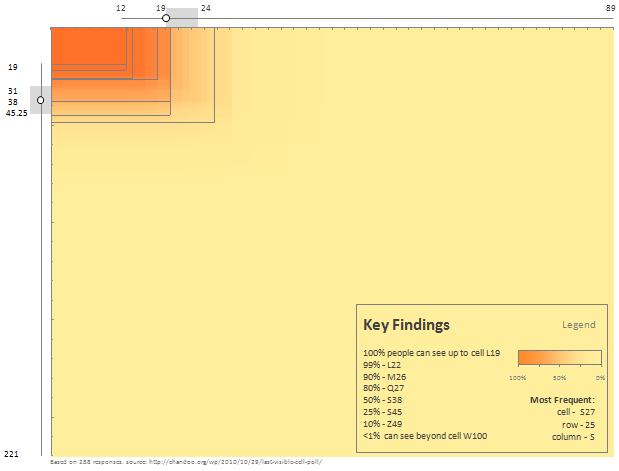
First let me show you the chart(s) I have prepared:
[click here for bigger version]
How to read this chart?
- The heat-map represents 221 rows & 89 columns worth of excel cells.
- Each cell is colored based on how much % of survey respondents could see it. The darker a cell is, more the people see it.
- The box plots at top and left show the distribution of visible columns & rows. For eg. the median columns visible is 19 and rows is 38.
- The grid lines show % of people who can see those cells progressively as indicated in the Key findings box.
- Source data: http://chandoo.org/wp/2010/10/29/last-visible-cell-poll/
- Chart inspiration: Browser Size by Google
What to do with this data?
If you publish excel files, you should fit as much as possible in to the range A1:M26.
How this chart is constructed?
- The heat-map is made with conditional formatting in Excel 2007. [video, tutorial, more..,]
- The Box plots are regular bar / column charts with extra series and a bit of formatting. Inspect the download file (link below) for details or get Jon’s box plot utility to make one.
- The legend is a regular column chart with gradient fill.
- The key findings is a text box with typed in text.
Key things to note about the data:
- Quite a few survey respondents mentioned more than one cell address in comments. I have considered only the first response.
- Many of you emailed me your cell addresses, but I did not consider that input as it was a tedious job going thru mails and extracting this information.
- I have removed one outlier where the cell address was something like A119. Rest all were fine.
Download the file with data & chart
Click here to download the file with survey data and charts [mirror here].
Feel free to play with the file to understand how it is constructed. You are welcome to play with the data and come up with alternative visualizations. Go ahead and dirty your hands…,
What do you think of this chart?
I have considered several options for visualizing this data. Finally, I took the inspiration from Google’s browser size and settled for the one you are seeing above. What do you think about it?
How would you have made this chart? Please share using comments.


14 Responses
Very cool, Chandoo, very cool.
That’s a very good idea, Chandoo.
I always knew the problem is there, but never realize what it is.
Wow… That is awesome Chandoo !
Wow. Love this! I might try something similar at work.
I would recommend a more ideal data gathering mechanism next time. Of course I don’t have any suggestions because I don’t know much about web design and gathering data through one, but something to keep in mind the next time you do an exercise like this.
This is awesome visualization technique for this type of data. I would use this whenever I’ll come accross such situation.
Many Thanks for sharing such an interesting information.
Did anyone else tell you how very cool this is? How about how “hot” it is? Thanks for sharing!
Hello,
This has been a challenge for me previously when developing dashboards.
As a Business Analyst, I work on a large monitor, with high res, and usually 65-75% zoom so I can clearly see the maximum amount of spreadsheet at any one time.
However, my target audience is usually executive level, or at the other end administration level and they use smaller monitors and lower res, and I have found most non developers use 100% zoom.
So when I develop and deliver a deshboard/ chart, it’s always a concern trying to deliver a product that needs minimal adjustment (for maximum initial impact) for many differing users.
Great discussion, but can we now come up with any solutions/ tips?
Christian
Hi
This is nice idea to present the excel how it is working
Thank you
Nagaraju
P49
V 49
Hi Chandoo.. Thank you for the wonderful post…
However, I have a question…
Why would you use
…The heat-map represents 221 rows & 89 columns worth of excel cells….
221 rows and 89 columns (is too much) while most of the data lies with in 26 columns and 49 rows (as per your Z49 or close by there)
So why would you choose 221 rows / 89 cols..?
Had you chosen a smaller number the heat area will be of a higher resolution and be made more clearer of where everyone lies with in, etc.. there is just too much unnecessary space wasted (in my opinion).. or am i wrong..??
Please make your input. Thanks.
@Good point Fiaz.. I had similar dilemma. So instead of cropping the chart, I used the additional white-space to overlay legend and key findings boxes.