Archive for August, 2012
Best Practice Modeling – Make these 5 changes today

Our guest author, Myles Arnott discusses what Best Practice Modeling is and offers 5 practical, easy to implement tips to get you started.
Best Practice Tip #1: Apply a modeling life cycle
Best Practice Tip #2: Give structure to your spreadsheets
Best Practice Tip #3: Make cells consistent based on their behavior
Best Practice Tip #4: Use similar formulas
Best Practice Tip #5: Build error checks in to your models
Read on…
Continue »Excel Salary Survey Dashboard Contest Winners

Finally the wait is over. Eager to know who won our Excel Salary Survey Dashboard contest? Read on.
Continue »
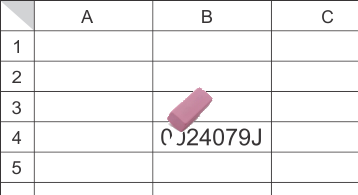
Today in Formula Forensics we look at how to strip away leading zeroes from strings with this simple array formula
Continue »Growing a Money Mustache using Excel [for fun]
Mustache and Excel?!? Sounds as unlikely as 3D pie charts & Peltier. But I have a story to tell. So grab a cup of coffee and follow me.
Today, lets talk about how to construct a dynamic chart that can show us how much progress we have made against a financial goal (in this case, accumulating a big chunk of money). I call this growing mustache chart, inspired from the wonderful Mr. Money Mustache.
Continue »Homework: Can you extract dates from text?

So who is up for a challenge? Can you use only formulas and extract dates buried inside text?
- Download this file.
- In column C, write a formula such that you can extract the date in column B
- If you succeed, post your solution here as a comment.
- If you fail, drink some coffee, start afresh.

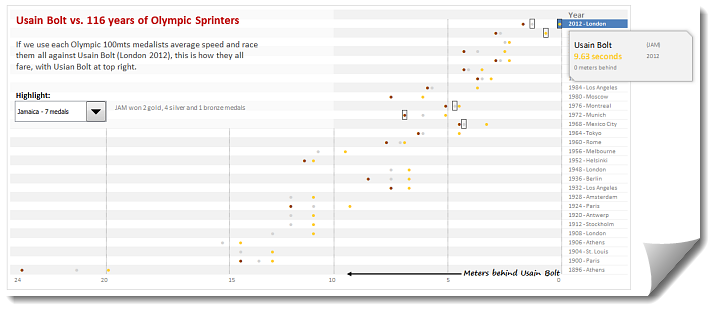
During London 2012 Olympics, Usain Bolt reached the 100mts finish line faster than anyone in just 9.63 seconds. Most of us would be still reading this paragraph before Mr. Bolt finished the race.
To put this in perspective, NY Times created a highly entertaining interactive visualization. Go ahead and check it out. I am sure you will love it.
So I wanted to create something similar in Excel. And here is what I came up with.
Continue »How fast can you finish this Excel Hurdles Challenge [Spreadsheet Olympics]
![How fast can you finish this Excel Hurdles Challenge [Spreadsheet Olympics]](https://img.chandoo.org/contests/excel-hurdles-challenge.png)
Watching the Olympic athletes run & jump all I could think of is,
- What should I eat to jump & sprint like that?
- How come I never heard about steeple chase?
- Should we really have 3 bullet points in all lists?
But I digress. Coming back, when watching one of those hurdles events, I got an idea as sharp as Chinese table tennis team.
Why not create a hurdles game in Excel to measure how good you are with keyboard?
So ladies & gentleman, let me present you our very own Olympics hurdle run.
Continue »
Today Formula Forensics looks at a formula that Highlights Only the Duplicate Entries in a range.
Continue »Excel Salary Survey Dashboards – Choose the winner [poll]
![Excel Salary Survey Dashboards – Choose the winner [poll]](https://img.chandoo.org/contests/ssc/excel-salary-dashboards-pick-the-winner-poll.png)
Recently, we published 66 dashboards visualizing Excel salaries around the world. Each of the contestants have put in great effort and hand-crafted these beauties. Now its time we picked a winner.
How does the voting work?
The voting has 2 components
- Readers (that is you) pick a winner and runner-up using online voting.
- Judges (2 of them) will also pick winners. Judges vote carries 20% weight.
![Making your dashboards interactive [Dashboard Essentials]](https://img.chandoo.org/vp/grammy-bump-chart-replication-in-excel-demo.gif)
Everyone likes to be in control. Even my 2 year old daughter jumps with joy when she lays her hands on TV remote. She pushes the buttons and assumes it is working. It is another story that we rarely watch TV at home.
By adding an element of control, we can make our dashboard reports fun. Interactive elements like form controls, slicers etc. invite users to play with your dashboard, get involved and understand data by asking questions. That is why I recommend making dashboards interactive.
Today lets understand how you can make dashboards interactive.
Continue »

