

It is not too sunny here, but I am going to put on my business man hat. At the end of each month, I ask myself if my business (chandoo.org that is) has performed better or worse. One simple way is to look at previous month’s numbers and then I know how good the latest month is.
But thanks to awesome people like you, my business is growing every month. So mere comparison with previous month’s values is not enough. I would like to know, for eg. if the latest month is,
- The best month ever
- The best month in last 12 months (trailing 12 months)
Now, it would be a shame if I have to find these answers manually. So I write an Excel formula. That is right!, a formula to tell me if the latest month’s value is all time best, best in last 12 months.
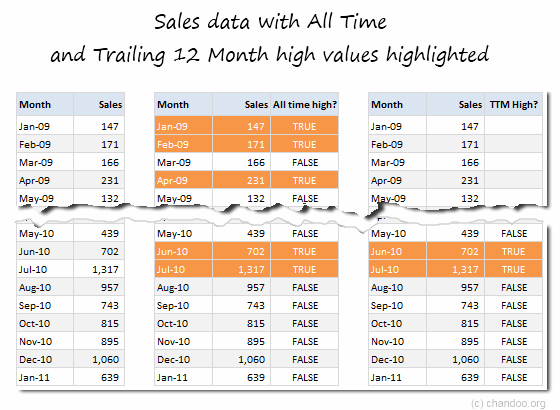
How to write such formulas?
Oh, the formulas are really simple. More so, if you compare it with the effort it takes to make a month all time best in sales (or any other metric).
Assuming we have a bunch of sales numbers by month in the range B6:C30,
To test for All time high condition:
- In cell D6, write =C6=MAX($C$6:C6)
- Drag the formula to fill remaining cells in column D
- Now you will see a bunch of TRUE and FALSE values. TRUE means the corresponding month’s sales is an all time high.
 Tip: See how we are using $C$6:C6 in the MAX. This style of referencing is called as mixed cell referencing. By using this, when you fill the formula for remaining months, the range inside MAX grows. Thus for each month we get the maximum sales value thus far. more ».
To test for Trailing 12 month high condition:
- We will test this condition in column E.
- In E17 (trailing 12 month high can not be calculated for first 11 months…) write = C17=MAX(C6:C17)
- Drag the formula to fill remaining cells in column E
- Now you will see a bunch of TRUE and FALSE values. TRUE means the corresponding month’s sales is a trailing 12 month high.
Tip: The range C6:C17 is relative. Thus when you fill the formula down, it changes to C7:C18, C8:C19… referring to previous 12 months. more ».Download Example Workbook
I have prepared a simple example file. Download it to understand these formulas.
How do you analyze your sales data?
Apart from the above techniques, I also use line charts & trend lines to understand the sales trend. Also, I use pivot tables to segment my sales based on product, customer type, region etc. Since my business is new, I do not have previous year values for many products. But where possible, I compare sales from last month same year to see how well the product has grown / shrunk. I do not set any targets at monthly level as I aim to enjoy the process. So I do not use bullet charts or target vs. actual charts per se.
What about you? How do you analyze sales or similar data? What metrics do you use to gauge the performance? Please share using comments.


3 Responses to “Top 5 Excel Skills you need to be a Successful Data Analyst in 2023 (podcast)”
Thanks Chandoo, some great helpful tips here. I'm quite good at Excel (mainly thanks to you!) but I'm always learning. I love the link you gave above to Dynamic Arrays & Spill Ranges, I understand them a bit more now, and can see some uses for them.
I am glad you enjoyed the show Dermot.
Great to see you back! Enjoyed when you first started the podcast and super excited to start listening to you again!