fbpx

Pivot Table Tricks to Make You a Star

Share

Facebook
Twitter
LinkedIn

Pivot Table Tricks ExcelWe, data junkies, love pivot tables. We think pivot tables are solution for everything (except for may be global warming and that broken espresso machine down stairs).

Today, we are going to learn 5 awesome pivot table tricks that will make you a star.

Click on these links to jump to tips.

Drill down pivot tables | Change Summary from Total | Slice & Dice Pivots | Difference from last month | Calculated Fields in Pivots

(If you are not familiar with basic pivot tables, you should check out this excellent pivot tables tutorial)

1. Drill down on your Pivots with Double click

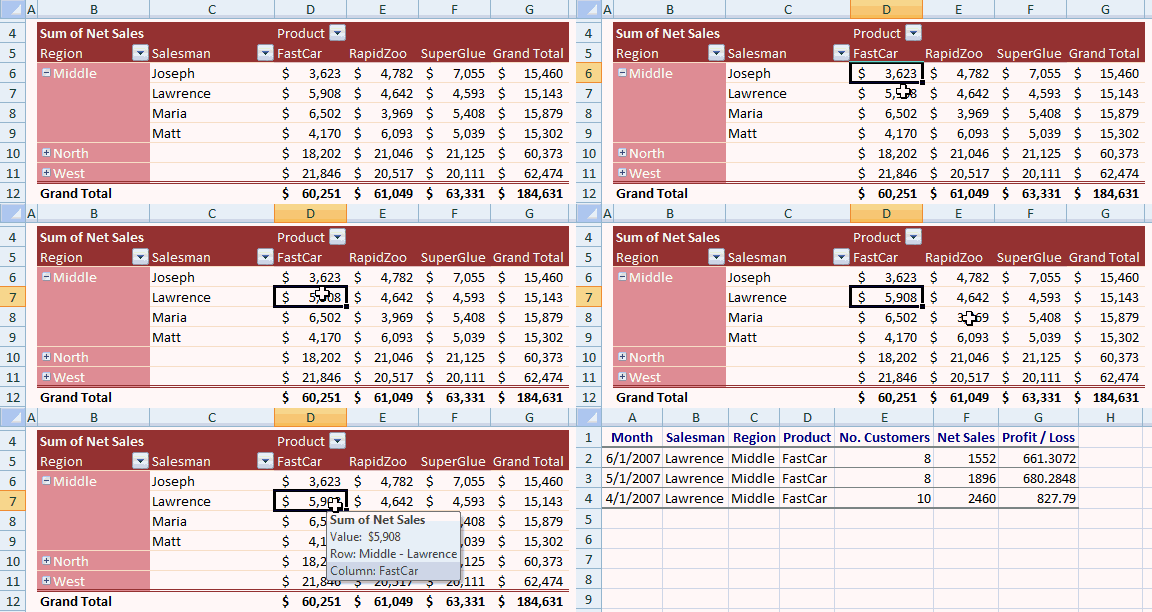
This is by far the simplest and most powerful pivot table trick I have learned. Whenever you want to see the values behind a pivot field just double click on it.

Lets say, the sales of Lawrence in Middle region  is $5,908 and you want to know which items contribute for this total, when you double click on the number $5,908 excel will show a list of all the records that add up to this number, neatly arranged in a new worksheet. Instant drill down.

See this magical trick in action.

Drill Down Pivot Tables

2. Summarize Pivot Data by “Average” or some other formula

By default excel summarizes pivot data by “sum” or “count” depending on data type. But often you may want to change this to say “average”, to answer questions like “what is the average sales per product”. To do this, just right click on pivot table values (not on row or column headings) and select “summarize data by” and select “Average” option.
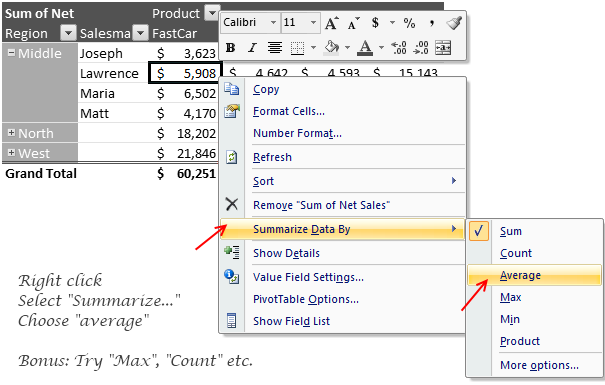
Summarize By Average Pivots

(In excel 2003, you have to do this from “field settings” menu option)

3. Slice & Dice your Pivot Tables with Grace

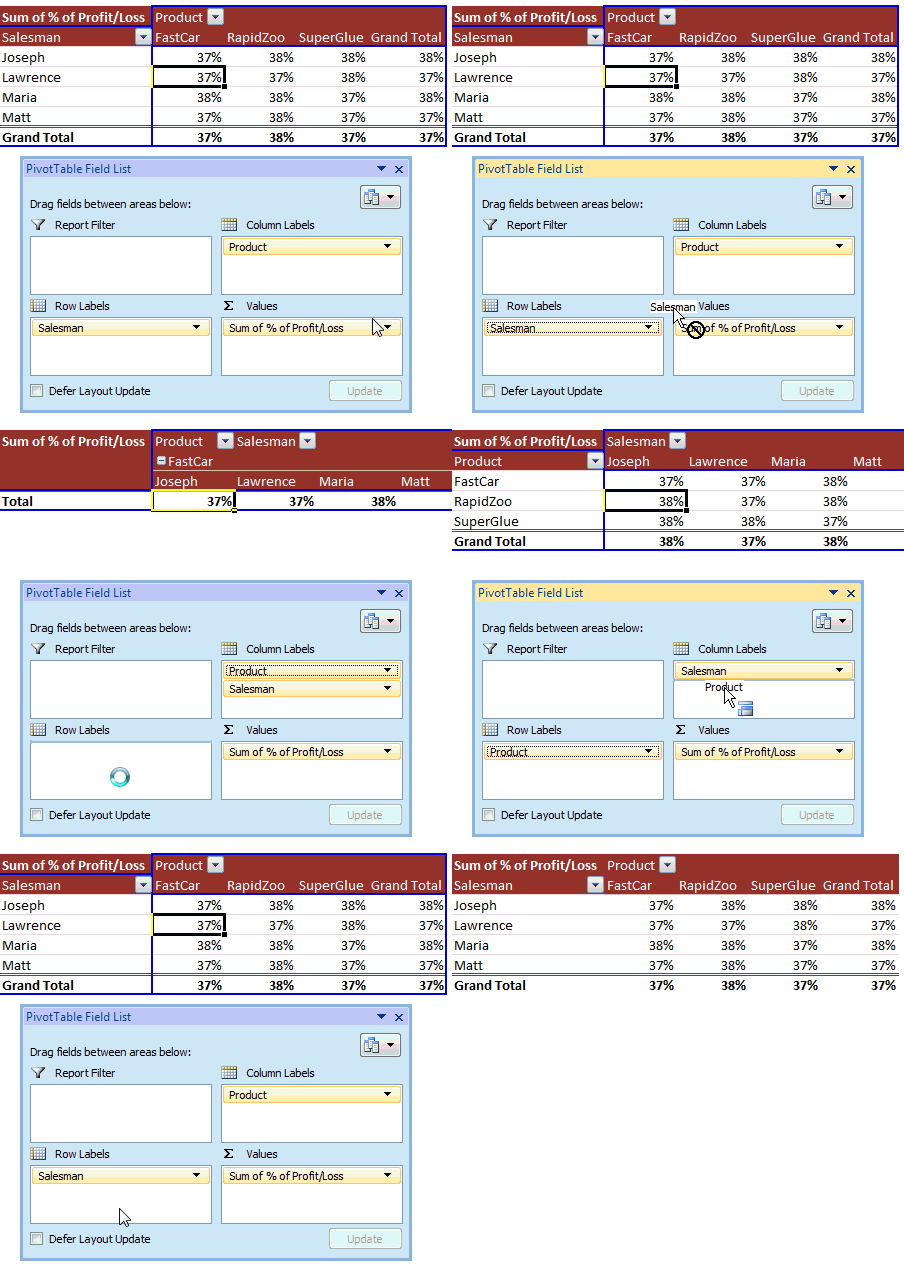
Re-arranging pivot table layouts is as easy as shuffling a pack of cards. Just drag and drop the fields from row areas to column areas (vice-a-versa) and you have the pivot table rearranged.

Here is a simple screencast explaining the secret

Slice And Dice Pivot Report

4. Show difference from last month (or year) without bending backwards

We all know that you can show monthly summaries using Pivots. But what if your boss wants you to also include “difference from previous month”  as well? Now, dont rush back to source data and add new columns. Here is the right trick to make you a star.

  • Just use field settings to tell excel how you want the data to be summarized.
  • Right click on any pivot table value, select “value field settings”
  • Now go to “Show value as tab” and Change “Normal” to “Difference from”
  • Select “Previous” from Base-item area. Leave Base field as-is.

Now, your pivot is updated to show difference from previous column.
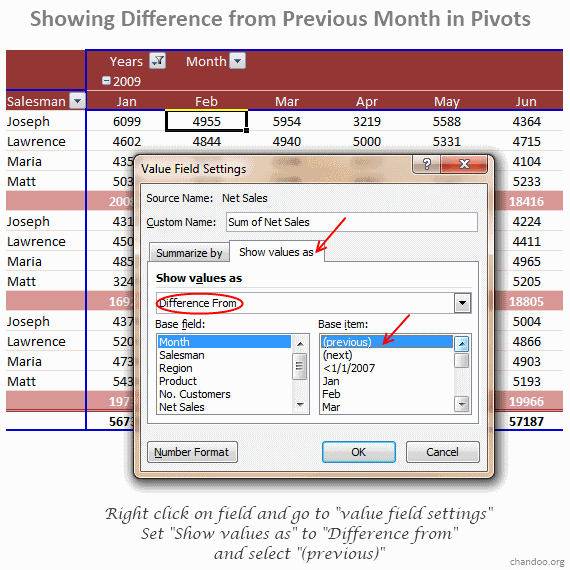
Difference From Last Month Pivot Report

Bonus: There are quite a few value field settings you can mess with. Go play and discover something fun. 🙂

5. Add new dimensions to your Pivot Reports with Calculated Fields

Let us say you have both “sale” and “profit” values in your source data. Now, your boss wants to know “profit %” in the pivot report (defined as Profit/Sales). You need not add any extra columns in your source data, instead you can define custom calculated fields with ease and use them in pivot reports.

  • To do this, Go to pivot table options ribbon, select “formulas” > “calculated field”
  • Now define a new calculated field by giving it a name and some meaningful formula.
  • Make sure you adjust the cell formatting so that output of calculation can be displayed (for eg. change number to % format)

(In excel 2003, the formula option is available from Pivot menu in toolbar)

See this tip in action:
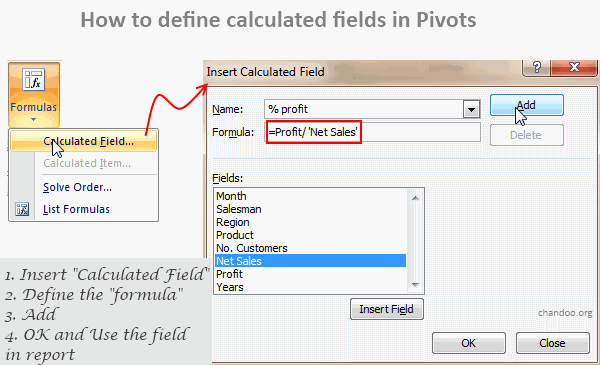
Calculated Fields Pivot Tables

What is your favorite pivot table trick?

Do you like pivot tables? What are your favorite tricks? What areas do you face difficulties? Tell me using comments.

Learn More about Pivot Tables:

Now if you excuse me, I will go check that espresso machine and see if the beans need a refresh.

Facebook
Twitter
LinkedIn

Share this tip with your colleagues

Excel and Power BI tips - Chandoo.org Newsletter

Get FREE Excel + Power BI Tips

Simple, fun and useful emails, once per week.

Learn & be awesome.

Welcome to Chandoo.org

Thank you so much for visiting. My aim is to make you awesome in Excel & Power BI. I do this by sharing videos, tips, examples and downloads on this website. There are more than 1,000 pages with all things Excel, Power BI, Dashboards & VBA here. Go ahead and spend few minutes to be AWESOME.

Read my storyFREE Excel tips book

Overall I learned a lot and I thought you did a great job of explaining how to do things. This will definitely elevate my reporting in the future.
Rebekah S
Reporting Analyst
Excel formula list - 100+ examples and howto guide for you

From simple to complex, there is a formula for every occasion. Check out the list now.

Calendars, invoices, trackers and much more. All free, fun and fantastic.

Advanced Pivot Table tricks

Power Query, Data model, DAX, Filters, Slicers, Conditional formats and beautiful charts. It's all here.

Still on fence about Power BI? In this getting started guide, learn what is Power BI, how to get it and how to create your first report from scratch.

142 Responses to “Pivot Table Tricks to Make You a Star”

  1. Steve M. says:

    I like to go to the last blank column in my data and then put in a few extra dummy headers to include in my tables. If you need to make up a column of something calculated from the rest of the data, you don't need to recreate the whole table. Just rename the column header and refresh the table.

  2. Nimesh says:

    I love Pivots.

    One thing few people don't like is the subtotals, and hiding them is not easy in 2003.
    The only option I found was in PivotTable Toolbar.

    One option I like is that the row fields or column fields can be dragged and dropped either on another side or can re rearranged too using dragging.

    I recently figured the importance of "Show Value As" where I wanted to show the row totals as % of Grand Total of all the rows.

    Pivots is a bless

  3. Jas from India says:

    good one, I knew all except 4th which is really helpful, thanks chandoo!

  4. Lee E. says:

    I was confused by your #1 example because the animation (screencast) did not match what you wrote:

    "....the sales of James in North is $23,012...when you double click on the number $23,012 excel will show a list of all the records that add up to this number, neatly arranged in a new worksheet."

    Instead, I believe it should read, "The sales of Lawrence in the Middle Region is $5908, and when you double-click on the number $5908, Excel will show a list of all of the records that add up to this number, neatly arranged in a row (i.e. $2460 + $1896 + $1552 = $5908)."

  5. Chandoo says:

    @Steve M: Good tip. I do that often to save some trouble during report generation.

    @Nimesh... Good tips about hiding sub-totals. Areas like these were made readily available (and accessible in 2007)

    @Jas: You are welcome Jas...

    @Lee: I corrected the sentence now. I didnt mean the screencast to convey the same. I wrote a simpler example, but showed a more complicated case in the animation. Thanks for pointing it out.

  6. ben says:

    Cheers, didn't know the first one, will come in very handy

  7. Nimesh says:

    Yes, that's one thing I like about 2007 🙂

    And I would like to add one more benefit of using Pivot - Creating chart from Pivot is just a one click job.

  8. priyanka says:

    I like all the tips , but what I am sad about excel 2007 is we cannot put the same field in value area if it is already there in either row or column area. For example: I have name in row and marks in columns. Now if i want the count of all marks I cannot drop the marks filed in value as it is already there in column. Whereas, in Excel 2003 we can do it.

    Can you pl. find some check on this and publish the solution for this.

    thnks

    • Francis says:

      Go to "PivotTable Option"
      Go to "Display" tab
      Check the "Classic PivotTable Layout"
      I still use the classic version because of your problem because I need to get the "count" and the "sum" of the same field.  
      Hope this helps.
       

    • NANDEESH H N says:

      Can you not include the same marks field again with setting as Count.

  9. Nimesh says:

    @priyanka: I don't know about 2007, but it's present in 2010.
    This might be one of those features where MS became mad and removed them from 2007, and then added back in 2010, just like the file menu 😀

  10. [...] There is no need to have calculated data in your data table, you may notice that I do not have calculated figures in the data sheet. Data points like Gross Margins, Margin % , Operating Profit and Operating Profit % will be calculated in Pivot Table using calculated field option. [...]

  11. [...] check out the Excel Pivot Tables – Tutorial, Pivot Table Tricks, Grouping Dates in Pivot Reports articles to get more [...]

  12. Andy says:

    Group
    PivotTables will group numerical fields (e.g. Age into age bands) and date/time fields (into months etc), although it won't like it if there is a blank record in the field.

    • Rebekah says:

      I'm looking to create a Pivot Table that is based off of individual days but I need it to group into weeks. Can you explain how I would do this?

      • Govindan Chinnakaruppan says:

        create a column with a function called weeknum with the date as a parameter. (you can define the starting day of the week also, by adding the second parameter viz saturday starting day of week = 16).
        Then use the weeknumber column as a part of the pivot table to group.

  13. Shel Price says:

    I have a spreadsheet that looks up data in another spreadsheet using a vlookup formula. I want to use a pivot table to summarize the data on the first spreadsheet including the data pulled in using the vlookup formula it doesn't seem to be working correctly when I try to sum the values from the lookup fields. Any ideas?

  14. Chandoo says:

    @Shel: Does the vlookup formula return any blanks or errors? Also, are the source values numbers or text looking like numbers?

  15. Shel Price says:

    Found a solution, used a function (ISNA) to fix the lookup formula so that when there wasn't a match to the lookup formula it would produce a blank cell rather than an error. This allowed the pivot table to calculate the sub and grand totals. Thanks for getting back to me. Shel

    • Dave Martin says:

      I have found that the "ISERROR" funtion is really useful in almost all potential error situations. You can use it rather than the ISNA. The format it simple. You type "=iserror(" whatever formula, vlookup for example, that you would normally use that causes the error, put in a comma and then the result you want if an error happens, such as a zero. The formula will then execute your original formula normally unless an error is found in which case it moves to your default. Super useful and nice to only remember one formula!

  16. katie says:

    I am trying to "Summarize Data By" then "Averages" in a pivot table however I keep getting the same error message that "Averages, standard deviations and and variances are not supported when pivot table report has calculated items".

    How can I fix this. I am fairly new and am tried to remove the calculated fields. The original table I exported from Sharepoint.

  17. [...] check out the Excel Pivot Tables – Tutorial, Pivot Table Tricks, Grouping Dates in Pivot Reports articles to get more [...]

  18. Stephanie says:

    I have a hard time keeping my comments to a row field in a Pivot Table. If I re-select the roll/columm, my comment still stay on that spot eventhought my subject data is change. Whatever ideas you all can help to get this remedied is greatly appreciated.

  19. Jameson says:

    I would like to filter my pivot table based on the values inside. Is there any way to do that on the second or third row label indentation?

  20. Amna says:

    really love the 1st one...didnt know before!!

  21. Royston says:

    I always wanted to calculate margins within a pivot table, thought there must be a way to do it but did not know till I found your tutorial on the web - great job, thanks

  22. Ramnath says:

    Hi Chandoo,

    I have a peculiar problem. I want to show some data points which are for the previous months (not a part of the Current month's Survey file) along with the current month Pivot table. I need to have Previous months data against respective Parameters in order to show the last month's performance.

    Is there any way to define some stangnent data points in a Pivot Table, which will not change? I am describing this as problem because, not all the Parameters will have values all the months. So, if some of them are missing, the total table will be collapsed as it has some external data which Excel cannot understand and arrange accordingly.

    Regards,
    Ramnath

  23. Kittu says:

    Hi,

    Is their any way I can filter calculated filed, for example if i calculate a percentage, I just want to display percentage greater that 70%
    is this possible ?
    Thank You,
    Kittu

  24. scurnow says:

    Hello...

    I have the same question as Kittu - filtering a pivot table display based on the value of a calculated field (using Excel 2003).

    Thank you,
    Shelley

  25. Choy says:

    Hello,
    I renamed an existing column header in my worksheet, and then created a new Pivot table. However, the new pivot is still displaying the old column header name and won't pick up the additional rows (values I added to this renamed column. Why not? How do I fix this? Thanks

  26. Hui... says:

    @Choy
    In the pivot table re-select the data source, not just refresh.

  27. Ravikant Narkhede says:

    Thanks lot for "Calculated Fields" trick...that was amazing..

  28. Russ says:

    In 2010, how can I highlight the row totals? It was easy in previous versions

  29. Mercedes Coates says:

    I have not been able to get my pivot table to display date formats. I have selected the date format within the value field settings. However, only the numerical value will show --even though the date shows up if I go into edit mode. Can you tell me what is causing this and how I can get the date format to show on the pivot table?

    • Hui... says:

      Check that your dates are numbers and not text
      Select a dare at the source and click on the , button
      It should display a number between 30-40,000
      If not your dates are text

  30. Joseph Lisboa says:

    Hello_
    Despite your good explanations I am still confused with calculated fields functions: Can I consider a Calculated field in a PV Table : a field containing data validation or just any cell formula outside the PV Table that uses the PV Table's results?
    Thank you
    Joseph

  31. ./A says:

    the pivot table drill through usually displays the underlying data in the worst possible format (2003) any ideas on how to have custom formats on the drill though sheet?

  32. Kathy Smyth says:

    We have a pivot table that collects information like "man days" a job will take.
    After it gets the "man day" total we want to have the info from the pivot table
    go into a cell on another worksheet. However the pivot table number of columns
    can change. How do I get the cell from the other worksheet to follow the cell
    from the pivot table that moves?

    • lockdalf says:

      Kathy, if the column moves but the header is always the same, I usually use match function instead of fixed column number. so the formula looks like this:

      =VLOOKUP("reference";"table";MATCH("column header"; "Header row";0);0)

      This nicely takes care of your problem if the header row is always the same. However, I am not sure about the case when you add filters above the core table and your header row moves down. I am sure it is possible and I personally would like to see and answer to that one...

  33. blrmkr says:

    For calculated columns in pivot tables, does anyone know of a way to create a calculated column that references an exeternal cell outside of the pivot table? (i.e. I want to take Sales * A5, where A5 is an external cell) Thanks in advance for the help!

  34. Ashley says:

    I am having the same problem as Stephanie.. I have a hard time keeping my comments to a row field in a Pivot Table. If I re-select the row/columm, my comment still stay on that spot eventhought my subject data is change. I need the comments to move with the data

  35. Divya says:

    Hi All,

    I have a lot of usage of Pivot tables in my work...I have a big table,which we refresh everyday and it shows the sales Details.It gets updated everyday cos it fetches data from our ERP.

    When I take the pivot of this table,I find 5 more fields listed in"Choose Fields to add to Report" box of the Pivot table Screen.
    I did some trials but am not really able to judge how those fields were created extra..!!
    Any suggestions,so that I can trace back as to how we can create Extra Fields in the Pivot,that are not in the Table.?(I guess they did some manipulation using Calculated Fields option.I am not sure who did it or when..,)

  36. Paul Coleman says:

    I lose my customized formatting on pivot table charts (e.g. data series colours on a bar graph) when refreshing data or filtering. Can anyone tell me how to prevent this from happening in Excel 2003?

    Paul Coleman

  37. KMil says:

    Is it possible to add a calculated field that uses a pivot table row total as part of the formula? I don't see a way to insert it as a field. I would like to use a calculated field with an IF statement. If the row count total is greater than a certain value display one text string, if not display another. Thanks in advance for any guidance!

    • Denise says:

      Just click the column next to the pivot table results, type "=If(" then point to the calculated field. It is a really long title that starts with "GetPivotData(...

  38. Chandra Shekar says:

    How to do first trick using VBA? Thanks!

  39. Hui... says:

    @Chandra
    Something like Range("B6").ShowDetail = True

  40. Chandra Shekar says:

    I tried this but in VBA getting particular cell in this case B6 is difficult and I need this data in the same sheet not in a new sheet.

    Thanks,

    Chandra Shekar B

  41. Deepa says:

    Hi Chandoo, Hui.. I have a in the Trick 4 - Difference from last month (or year) .. Tried this and i am getting an #N/A error in all cells. Any way of correcting this?

  42. Rajesh Joshi says:

    Hi,
    Is there a way to show data filed instead of sum, average etc. I have a sheet wherein I have already calculated the monthly percentage based on certain formulas. But when I am creating pivot table it is either sum/count or averaging the data.

    Thankd
    Rajesh

  43. Deepa says:

    Hi Chandoo
    I have a problem in the Trick 4 – Difference from last month (or year) .. Tried this and i am getting an #N/A error in all cells. Any way of correcting this? / Any hints on why this issue could be arising..?

  44. Rajendra says:

    How do I get Average total On Raw Grand Totals
    YTD-Employee Count Summary -2010
    MONTH Data
    Jan-10 Feb-10 Mar-10 Total *EMP_COUNT Total *GSALARY-PAY
    Designation *EMP_COUNT *GSALARY-PAY *EMP_COUNT *GSALARY-PAY *EMP_COUNT *GSALARY-PAY
    Analytical Development - Officer 1 289 1 325 2 614
    Assistant Manager 9 4,251 11 4,795 10 5,374 30 14,420
    Assistant Operator 1 218 1 260 1 280 3 758
    Asst 2 450 2 417 1 175 5 1,042

  45. Ann M. says:

    How do you delete calculated fields from the field list?

  46. Ramalingma says:

    It is awesome and so helpful to the beginners.

  47. Suma says:

    It sounds simple but I have not been able to do it, ir maybe not possible. I have a column of Org code and org name in my master sheet. I create pivot of finances by org code, but also want org name in the adjacent column for others to review. I normally have to cut paste after pivot is done as I can never them the two columsn in pivot side by side.
    It it possible at all?

    • lockdalf says:

      Suma, you should have no problem with this since, as I understand this, it is one org code per one org name. I have a similar situation where I usually only use customer number in my reports, but some people require a customer name also. All you need to do is to pull both your org code and org name into row headers (in older version pull the fields all the way to the left) and remove automatic subtotals on the first column so the data is not messy..

    • 5antiago says:

      I have had a similar issue with customer name and customer code and my solution was to create a helper control in the original data that is a formula: =<name>&" - "&<code>".  Then I would use this column as the basis for the pivot table rows

  48. Dsouza says:

    I have added a percentage column in my Pivot table. but do not know how to get the cumalative percentage within the pivot Table. (Excel 2007)
    Can you help?

  49. Dsouza says:

    Just trying to explain myself in more details. I need to put in a pivot table the cumulative percentage of an analysis of data. But pivot table doesn't cumulate. I need help with that. I'm trying to make something like the histogram function of excel but in a pivot table that can change the data through filters and the pivot table calculate the cumulative percentages automatic depends on the information. Currently, I'm calculating it outside of the pivot table, but everytime I refresh, I have to redo it. I am using Excel 2007

  50. Greg says:

    Thanks for these tricks.
    I read the comments and thought it might be helpful to contribute.

    When creating your pivot table use a named range. This is especially helpful if frequent data refreshing is occurring with differing number of records.

    If you have contiguous data in a single region take it up a level, go to Formulas.Defined names.Name manager and create a dynamic named range using the OFFSET function.
    =OFFSET(ws_data!$A$1,0,0,COUNTA(ws_data!$A:$A),COUNTA(ws_data!$1:$1))

    For an explanation of the OFFSET function see,
    http://office.microsoft.com/client/helppreview.aspx?AssetId=HP103427399990&lcid=3081&NS=EXCEL&Version=12&respos=0&CTT=1&queryid=ee6cf526%2D29ca%2D43b8%2Dab34%2Dbea22642fa6c

  51. Greg says:

    Suma - September 23, 2011

    You could create a new column in your master data which is a concatenation of the ORG code and the ORG name eg: =CONCATENATE(org_code," ",org_name)

    If you are using the dynamic named range above you will only have to refresh the pivot table and choose the new field from the field list for the Row Labels.

  52. Tom says:

    I like using the Pivot tool. Your examples were good. Though one problem I have is subtotals adding instead of Averaging. Let's say I'm comparing prices at my store to competitor store. I have the 2 prices and I create a metic of my price less comp price. I then indicate I want that fact to be averaged (not summed). I have my products in groups. At the group level, it is the sum of the details as opposed to average. I looked at Solve Order but it came up blank. Any thoughts?

  53. Venkatesh says:

    Is there is any shortcut key to drill down insted of double click...?

  54. Hui says:

    @Venkatesh
    You could record a macro to do that and assign it to a key stroke combination

  55. Venkatesh says:

    @Hui
    Thanks, Shortcut is "Properties key + e"

  56. Prash says:

    I am trying to refresh a grouped item in the pivot table after deleting some data from the source of the pivot but cannot refresh the grouped pivot field/row or column.

    I keep getting an error message that says "This command requires at least two rows of data." even after I select the whoel data range it will not refresh. Even after I sleect 2 rows, it will not refrsh and posps up the same error message.

  57. Christophe says:

    Hi,
    As you mentioned before, "We all know that you can show monthly summaries using Pivots. But what if your boss wants you to also include “difference from previous month” as well? Now, dont rush back to source data and add new columns. Here is the right trick to make you a star." but in this way we can have the difference between the columns or the value of the columns but not both, You think it is feasible to have the value of the columns and their difference in the next column on the right as it is considered as a grand total.
    thank you in advane.

  58. tomas greene says:

    hi there
    I created a calculated field, but it's always displayed as 'sum' even if I define it to be displayed as 'average' 'count' etc
    any clues? ... if anyonw could send me the answer to my email I would greatly appreciate it
    cheers

  59. Bonnie Kirk says:

    Good morning,
    I have been creating pivot tables for years, extracting data from an external database. I have now moved to Excel 2010 and am having to tweek some of my older tables. One question I have is how do you add a blank column in a pivot table. I tried inserting a '0' field in my SQL statement but it messed up the pivot table.
    Any suggestions?

  60. Praveen M N says:

    hi Chandu,

    could you please provide if there is any link about formatting pivot table(Making
    in-appropriate pivot in an appropriate form).

    this blog is very useful thank you very much.

    Praveen

  61. Todd Buttrick says:

    I love the pivot table drill-down option in Excel. Ever since switching to 2007, I haven't been able to use the double click drill-down option on spreadsheets that I've saved and reopened. It only seems to work while I'm in a new, active spreadsheet.
    Todd

  62. Alan says:

    I am trying to create a pivot table which enables me to manipulate data quickly and efficiently but falling on my face here. Here's my problem:

    I create site reports. I carry out safet based inspections and look at a number of areas eg traffic movement, welfare provision, electrical inspections etc. I then categorise my findings by importance, with S being "satisfactory", C being low risk, B being mid risk, A being high risk. When I produce a pivot table, I can arrange the table so the UK region is a filter and the row lable is the site name, and column labels are the areas I look at (traffic movement etc). The data goes into the data area. No problem so far. However, the data presents me with a table of the cumulative count of my scoring (so 2 S and 2 C ratings would show as "4" in the pivot table. What I want, is to be able to show the data in the pivot table as follows: row as site name, columns as area (traffic management0 then a breakdown under this showing number of S, C, B and A ratings for each area. for the life of me, I cant find a way to do it! I have also tried Microsoft Access, to similar results. HELP!

  63. Hui... says:

    @Alan
    You can have multiple levels of Row/Column
    Just drag another field into the Row/Column area and excel will subdivide the Rows/Columns by the new Field

  64. Greg says:

    @Alan,

    I think it is where you are placing your "risk" field in the pivot table.
    From the description above all the fields are categorical. ie not measures.

    Hui is correct. You will, also need to drag the "risk" category to the Rows.
    For a measure, put a field, say the report's index number on the Values area, and if it does not do it intuitively, change "summarize value field by" to count with no decimal places.

  65. Mike Fox says:

    I need to freeze the first column and the first 6 rows in a pivot table. If I freeze the first column, then I can freeze only row 1. If I freeze the first six rows, then I cannot freeze the first column. Can you help me. Thank you.

  66. Prash says:

    @ Mike Fox - Assuming you have a rows of data on rows 1-6 and data on column 1, all you need to do is go to cell B7 then click on View, then Freeze Panes. It will freeze Column1 and rows 1 through 6. Hope this helps.
    (MS EXCEL 2010 Version is what im using)

  67. Chamara Lakmal says:

    Is there a way to present pivot table data as a percentage of subtotal ?

  68. Greg says:

    @ Chamara Lakmal

    For just this purpose Microsoft has been good enough to include in Excel 2010, additional choices in the Value Field Settings | Show Values As,
    % of Parent [Row, Column, Total]

  69. Lokesh says:

    Good one thanks for the update on Pivot table.

    But when i say days it will not take the start date of the month rather it will take the first day to seven days at the end the days per week will be a mistake. Can u please help on this.

  70. Charlie Epes says:

    Hi Chandoo:
    is it possible to use the REPT function in a pivot table inserted calculated field?

    Example: =REPT("|", A1)

    Thank you -

    Charlie Epes
    Buffalo, NY

  71. Kalmeenow says:

    Dear Pal

    Thanks for sharing the knowledge nice & useful site.
    I'm working on large amount of data, and I need to show the values in “Average” & "Median"
    As you shown in your Second Example "Summarize Pivot Data by “Average” or some other formula" I got the values in average is there is any other way to get the Median instead of Average

    -Kalmeenow

  72. S.A.Ramayya says:

    I have 5 years of Data in Excel - Day wise.I have re arranged the data in Pivot Table and in the report filter i have made the date filed in to years.so that data can be looked into year wise.

    But I want those yearly data into columns.I need the data in the following manner.
    product year 2007 2008 2009 2010 2011.under years columns i need the qty sold in that particular year corresponding to the item.How to get this?Pls help me ASAP

  73. Charlie Epes says:

    Hi:
    Once I add a calc field, how do I edit the formula?

    Thanks-

    Charlie

  74. Adrian says:

    I like the calculated field option but I need to do something a bit more complex. I want to calculate the average differently on the subtotals than the rows, is this possible? I want to average the rows normally, which is easy to achieve with a calc field, but I want to AVERAGEIF(range,">0") on the subtotals.

    Many thanks in advance for your help.

  75. Swapnil says:

    Hi Chadu,
    In excel 2003, i have a pivot table with data for eg. day bucketing :>2 days, 2-4 days etc & count below this heading.
    If i double click on any of the value in particular bucket, it opens ALL the colum data on which again i need to filter.

    Is there any way of opening the data only for the particular col/value?

    • joovila says:

      hi this is a nice post Is there a way to display the filter criteria in a pivot table for the purpose of showing it on a pivot chart. 5 tricks are very Helpful.

    • lucky says:

      I like using the Pivot tool. Your examples were good. Though one problem I have is subtotals adding instead of Averaging.“Summarize Pivot Data by “Average” or some other formula” I got the values in average is there is any other way to get the Median instead of Average

  76. I still have not understood trick 4 (Show difference from last month).  Is it possible to understand it in an easy manner?

  77. Raj says:

    Instead of showing the sum or avg, can I just show the value of the field itself? For eg I have the details about the schools, its ranks, city, state, private/public/Charted, score etc in the xls. Can I have row as city, column as whether its private or public and show the rank as the value? I dont want to sum the rank or get the avg of the rank, it doesnt make sense. All I need is to understand quickly a city and its rank along with the school is a public, private or charted one etc

    Any help will be greatly appreciated... 

  78. seraj says:

    Hi,

    I am facing the problem while using calculated field in pivot table.. 

  79. Anne Walsh says:

    hi 
    If I am getting the same information month after month and I also want to do monthly comparisons, would it make sense to put all the data into one big list and then do the pivot table on that?  Or is there a better way to do it?

    • GregS says:

      @Ann Walsh,
      Pivot tables can use multiple ranges, but not knowing how many there is I would be inclined to use one big list as you have said.
      Reading between the lines this is a continuing process. I think, to make it easy to update, I would put the monthly worksheets in a single workbook.
      Ensure each ROW or COLUMN has a value to identify the Year, Month, etc
      Use Data | Data Tools | Consolidate to combine multiple ranges into one
      Create a dynamic range (search OFFSET on this page) or use Home | Styles | Format as Table
      Create your PivotTable | Table/Range:[Name from previous step]

  80. Siva says:

    4th one is different. its very helpful

  81. Siva says:

    Hi,

    5 tricks are very Helpful. & i need simple help How to merge the two pivot table values. kindly reply the solution for this.

    Thanks 

  82. 5antiago says:

    Love #4, I didn't know that.  Thanks!

  83. Birpal Singh says:

    My Question is this ?

    In your Explanation about data export from pivat table.
    i have to click on each total again and again.
    http://www.ehow.com/how_5973777_export-pivot-table-data-excel.html

    Boss I have 1 file with 1000+ vender Details.
    How will i do click on alls.

    Can u plz. help me to do the click work automatically by excel.
    and i will save each file with different vender name.

    Plz. Help.

    Waiting for your reply.

    • Hui... says:

      @Birpal

      I would look at a different method of retrieving what your after than clicking on pivot tables

      Can you post a sample file, Refer: http://chandoo.org/forums/topic/posting-a-sample-workbook

      with details of what fields you need to retrieve and in what format

      • Birpal Singh says:

        Thanks for your quick response.
        Here is the link of my Sample File

        http://www.2shared.com/file/kja6fv6q/Venders_Data.html

        There is 3 sheets in the file
        1st is full data sheet.
        2nd is pivot table.
        3rd is Format (in which format i want to export from pivot)

        My mean to say that i want export one by one customer with headers in individual files.
        as like i have 10 venders master data in 1 sheet.
        i have to make 10 different excel file with full details in same format.

        kindly help and solve this big problem.
        and make it eary or automatically for me.

        Waiting for your reply.

        Thanking You,

        Regards:
        Birpal Singh

  84. Arindam says:

    @Chandoo, great work... 

  85. Tbasi says:

    See my post, on Nov 21.

    Is there a way to display the filter criteria (value filter) in a pivot table for the purpose of showing it on a pivot chart.
    So that people looking at the chart know how its been filtered.

  86. OsmO says:

    Dears,
    For kind support, How to arrange the pivot table for row by row if it's large file.
    Your reply will be highly grateful. 

  87. Caraujo says:

    I'm a big fan of pivot table. But there is something that I couldn’t figure it out…
    Does anyone know if you can select a group of fields in the Pivottable Field List and drag it into the values area? The only way that I know is that you have to select one by one and drag it into the area that you want.
    Thanks, Caraujo

    • Pedro says:

      Caraujo, I am not aware of a way to select multiple items at one time (as in CTRL or Shift as with normal cell seclections). In the Pivot Table Field List you can check the fields fairly easily, which may be faster than dragging to the Value fields. Sorry, perhaps Chandoo has an answer for you (that's why we come to this site, to learn).

  88. Pedro says:

    # 3 Above - Is it possible to use both Row Labels & Column Labels to arrange data? Poorly worded question, I wish I could share an image of what I have in my Pivot Table, and what I want it to look like (regular cells with various formulas). Not sure how this will appear on screen
    A B C D
    Product C Product D
    East Sales 10 5
    Forecast 12 8
    West Sales 15 6
    Forecast 14 9

    It seems like this should be easy and possible, but for some reason I can't figure it out today. Posted here because this site shows users many concepts and adding this to #3 above would likely help many.

    • Pedro says:

      Sorry that looked awful. The difficulty is that all of the data comes from a single row. The row has columns for East Product C Sales, East Product C Forecast, East Product D Sales, East Product D Forecast. Then another row will have all those same columns but for a different region (i.e. West). This may be a matter of how my data is arranged, I can get there if I break the data up with a different row for East Product C and East Product D in another row. It seems like this should be possible within a Pivot Table (without re-arranging data). Food for thought for a future posting on Chandoo, which is a super helpful site (I can't tell you how much better my Dashboard is because of this site).

  89. Rohan Gham says:

    Hii Chandoo,
    Thanks for post.
    The difference from last month works really well..very easy for analysis at just one go without going back to source data and adding columns & formulas.

  90. mahesh says:

    using excel 2010
    need to add date wise (product count ) to values..its for 90 to 120 days ..
    so every day i wants to do it manualy by selecting each day from filed.. is there any short cut to move all days to valuse in a single click or any other idea to select all days to values...

  91. Suresh says:

    Nice tips!

  92. A Aziz says:

    I have a question,

    i have too many values that i need to add all of them to the pivot table, and it's just very much time consuming to drag one by one to the values section. is there a way to select all and add them to the values section?

  93. NANDEESH H N says:

    Sir,
    While adding field names to the values quadrant of pivot table, the default value setting is Count. How to change the default to Sum. Otherwise, I have to change the value field setting to SUM individually.

  94. Chitra Fule says:

    Hi

    Really need help in getting the Median values for a categroy in the pivot table that is created using the new worksheet option.

    this means i have the base file (data source) in one sheet of the workbook and the Pivot table in the Other Sheet of the same workbook

    i have different categories and efforst against them. and need the median of these efforts in the pivot table refer to table below for more clarity

    can someone please help on this urgently

    Eg:
    I need the Area wise Median of efforts(hrs) in the Pivot table. I cant have the Pivot created in the same workseet as the data is huge, hence will have to create it in New Worksheet.
    I have listed down the data to be used for the pivot to understand how we can go ahead for the median as the atual data is huge and cant be listed here.

    Data source:
    Area Efforts (hrs) Role id Type
    Mumbai 12 123 Full time
    Pune 20 124 Parttime
    Delhi 22 125 Parttime
    Mumbai 22 126 Parttime
    Mumbai 21 127 Parttime
    Mumbai 23 128 Parttime
    Pune 24 129 Parttime
    Mumbai 13 130 Full time
    Delhi 12 111 Full time
    Delhi 1 112 Full time
    Delhi 1 113 Full time
    Delhi 23 121 Full time

  95. Ashish says:

    Hi,

    Can someone help me to reproduce data from pivot .

    Pivot summarizes data. I want it to reproduce the data in a new worksheet when I double click on any value.

    Suppose I have "2" in the values column for a category. When I click the value 2, I want excel to create a new spreadsheet and reproduce the data of the rows from which this value has been derived.

    I know this is possible but not able to figure out how.

    Any help or clue will be appreciated.

  96. SteveJ says:

    I pull a lot of data for analysis, and I try to keep the file size small by eliminating data fileds that can be calculated in the pivot table. For example, I pull dollars and units and create average price, instead of pulling average price in my base data.
    However, my calculated fields sometimes come back blank when I update my base data. I am using an offset formula to ensure all data in rows and columns are captured for the pivot table data. I have read that sometimes when additional columns are inserted in the base data it causes this to occur, but in the most recent update, I added no additional columns. I’d love to know if anyone has found a way to protect calculations from disappearing on updates--whether adding columns or not.
    Thanks, Steve

  97. saravanan says:

    hi,
    I am creating a Pivot table based on a data like this
    Category of issue and Issue no raised , if issueno is not raised it will be blank My pivot table should have the List of category , No of issues arised and No of issue nos
    Category Issue No
    --------------------------------
    Application 404
    Application
    Databases 405
    Network
    Network 324
    Network
    Services 122
    Services
    In the Pivot Table , I placed the Category in the row label , this automatically groups the elements . under the Values , i place again the Category and the Issue No . For The Summarize Value field by i used the Count function
    So my Resultant Pivot Table was like this
    ROWLABELS Count of Category Count of issueno
    --------------------------------------------------------------------
    Application 30 13
    Databases 15 6
    Network 10 3
    Services 33 3

    I have to get a 3rd Value column which is ( Count of category) - (count of Issueno)
    I tried a lot of things but couldnt get this
    can you guide me in this

  98. […] at the Pointy Haired Dilbert blog, has posted 5 Excel Pivot Table tricks today. His blog posts are always informative and entertaining, so go and take a […]

  99. Chinyere says:

    I love the pivot table a lot but I don't know how to align my data like your from the example you gave and I am not able to create region and salesmen to look like yours is very sad to me because I manipulate data of such and how to insert formula to me pivot data I use Excel 2007 what will I do.

  100. Sharon Fields says:

    I need to pull data from a pivot table, not the column or row headings and was trying to select and copy the data.

    Are there specific keyboard shortcuts for pivot tables.
    I was trying Shift + End and Shift + Right arrow and it is not working.

    Thanks in advance for any tips.

  101. Nasa says:

    I have common cities in column A, total is coming 100 but actual cities are 50. So how can I pivot table for this and show actual count of cities, i e. 50 ?

    I don't want to put formula here only through pivot table.

    Regards,
    nasa mulla

  102. Summer says:

    Hi. I'm trying to learn pivot tables, and I'm running the examples you've given above on the sample data you've given in the links, as a test. I had trouble reproducing the percentage profit in #5. I typed in the same formula you have above, but received this error message:

    "An item name cannot be found. Check that you've typed the name correctly and the item is present in the PivotTable report."

    and then immediately after,

    "The formula you typed contains an error".

    Can someone please help? Thanks 🙂

  103. Kat says:

    Hi

    Thanks for the tip about drilling-down tables! I needed that! 🙂 You are absolutely fantastic! It used to take me at least a week to compile my sales data into a report summarising each outlet's quantity and sales. Now it takes me all of 5 minutes. THANK YOU!!!

    I have a small question. My boss has a set format for the tables (red for decrease, green for increase). The drill-down tables come out in blue. Is there a way to change the default colour settings, so I can get it in black and white? Then it won't disrupt the format specified by my boss.

    Thank you! 🙂 🙂

    • Kat says:

      Hi,

      Never mind, I found it 🙂

      If anyone reading this wants to know as well, I went to Table Tools>Design>Table Styles. I picked a black and white one, right clicked on it, and selected "set as default".

      Cheers 🙂

  104. mickexay says:

    please have issue with referencing data from pivot report. the error meassge is always #VALUE!
    Can anyone help me out?

    Thanksssssss

  105. Lisa says:

    I am relatively new to pivot tables and have even bought a book, and reviewed many tutorials but still cannot seem to get the end result I am looking for.

    I have multiple sets of data in the pivot, and the % by column or percentage by row does not work in this scenario. I am looking for percentage by overall total.

    Am I missing something? Is there something I can do to get the correct percentages?

    I have even tried writing my own formula outside of the table, but then cannot link it to adjust for additional data or link the the chart.

    Any and all help would be accepted.

    Thanks

  106. prakash says:

    Dear sir,
    Is it possible to group values(numbers) given in rows as our own desired range..
    Since, i got range as given by fixed step. But my requirement is slightly different.
    For ex:
    In pivoted table:
    Age count
    45 3
    87 2
    34 1
    56 2

    For above data i can easily get group in following range
    20 to 30
    30 to 40
    40 to 50...
    ..
    80 to 90
    90 to 100 (for constant steps)

    But my requirement is range of type:
    20 to 30
    30 to 59
    59 to 75
    75 to 85
    85 above..(where steps not same...!!!!)

  107. prakash says:

    Dear sir,
    Is it possible to group values(numbers) given in rows as our own desired range..
    Since, i got range as given by fixed step. But my requirement is slightly different.
    For ex:
    In pivoted table:
    Age count
    45 3
    87 2
    34 1
    56 2
    For above data i can easily get group in following range
    20 to 30
    30 to 40
    40 to 50...
    ..
    80 to 90
    90 to 100 (for constant steps)
    But my requirement is range of type:
    20 to 30
    30 to 59
    59 to 75
    75 to 85
    85 above..(where steps not same...!!!!)

  108. prakash says:

    Dear sir,
    Is it possible to group values(numbers) given in rows as our own desired range.since, i got range as given by fixed step. But my requirement is slightly different.
    For ex:
    In pivoted table:
    Age count
    45 3
    87 2
    34 1
    56 2
    For above data i can easily get group in following range
    20 to 30
    30 to 40
    40 to 50...
    ..
    80 to 90
    90 to 100 (for constant steps)
    But my requirement is range of type:
    20 to 30
    30 to 59
    59 to 75
    75 to 85
    85 above..(where steps not same...!!!!)

  109. DannyZ says:

    SUPER! Tons of thanks for this knowledge sharing!
    I was tortured by the data analysis in the past few months but now I'm going to torture the data with the tips ---- until they are confessed!

  110. silika majhi says:

    Hi ,

    Superb Tutorials.
    However, I am not getting the 4th point. So, do you have any video to explain the same. It would be very helpful.

    Thanks,
    Silika

  111. Amitsingh Rajput says:

    Hi,
    So much keen attention that's great to see how much you learn each and every minute.
    Great, keep it up.

    Thanks & Regards,
    Amitsingh Rajput
    +1 647 629 2908

  112. Kristy says:

    I also find the drill-down by double-clicking very helpful. However I've come across a problem. If a calculated field is involved, the drill down results exclude that data and only shows the data related to non-calculated fields. For instance, my pivot table has 4 columns of sums, and a grand total column. One of the columns is a calculated field. When I double-click on a sum in the grand total column, it gives me the data for only the non-calculated field columns and leaves out the calculated field data. (And double-clicking on a sum in the calculated field column only opens up the underlying formula so I can edit it. It doesn't show me the drill down.) Do you know of any way around this?

  113. Mauricio says:

    My brother suggested I might like this web site. He was entirely
    right. This post trul made my day. You can not imagine just how much time I had
    spenmt for this information! Thanks!

  114. Palani says:

    Hi

    I have created a report using pivot table. In this I need to add a column containing some values manual. That values are constant and no changes will occur.
    Example :

    Budget hours: 2000 hrs for a proj.

    I have created pivot table containing hours used month wise eg.1500 hrs.

    I need to refresh every month to have % of consumption/Budget + Balance hours in separate columns from Budget hours.

    Please give me a suitable solution.

Leave a Reply