Distinct Count & Blanks – Power Pivot Real Life Example
When it comes to analyzing business data, managers are always asking, “so how many distinct x each y is doing?”
And that sends us, data analysts & reporting professionals running from pillar to post figuring out the best way to do it.
- We can use variations of SUMPRODUCT, COUNTIFS etc, but the methods are not flexible..
- We can use VBA, but it would become slow as you add more data.
- We can use Pivot tables, but it only gives half of what we want ie each y part, but not distinct count of x.
- We might as well shave our head with a shovel before manually counting values.
And that brings us to 2 distinctly simple solutions:
- Using Power Pivot & Excel 2010
- Using regular pivot tables in Excel 2013
Today, lets talk about these 2 approaches & see why they are so better than anything else for distinct count situations.
Distinct count problem faced by Joanne:
Joanne, one our readers sent me this email few days ago,
Here is something that I thought your readers might be interested in, as a real life business example. I always have the need for unique counts in my Excel sheets and was elated to find out that MS had built this function into 2013 pivot tables. I generally use SUMPRODUCT to get to my answer, but some of my files take hours to calculate with this formula. Since I am still waiting for my 2013 CD to arrive, I took advantage of the addin to 2010 to play around with this new technology. At first, I was very excited at the ease of use to get to a unique number. But then looking into the results a little more, I found out it was skewed. Here is what I mean.
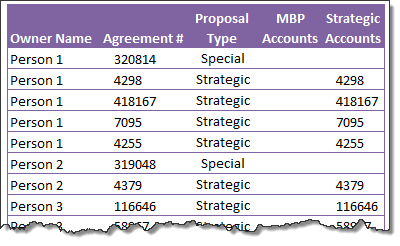
This is my data, simplified a little and any confidential information has been taken out. The last two columns are “helper” columns for my pivot. They basically return the agreement number if the proposal type is a certain value. If it doesn’t find a match, it leaves it blank. Data is sorted only so its easier to see how the pivot tables arrive at the answers.

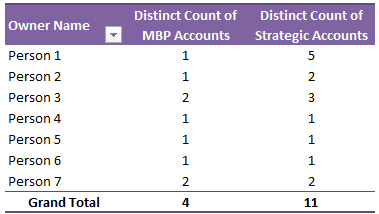
The blank is what messes it up. Doing a simple pivot with DistinctCount, the numbers are definitely wrong. Its counting the blank fields as one of the items, so everything increases by one. The Grand Total is correct, sort of, but its misleading. There are 4 unique MBP accounts, 3 with actual agreement numbers and one blank, but looking at the numbers in the column, it doesn’t add up to 4 visually.

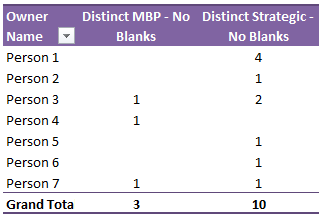
So there was my challenge, to get a DistinctCount, but ignoring all the blank fields within the data set. Using a New Measure, I was able to create a formula for the pivot that ignored the blank cells. It’s a little complex, but what good Excel formula isn’t? Once that was created, the pivot worked and the grand totals are more accurate. I did try using the DistintCount-1, but it didn’t come to the same answer. When it did work and the total was 1, it showed zero, which is correct. But I like the clean look below of showing nothing, thus not tempting the user to click on the zero.
MBP formula: calculate(distinctcount(('Implemented'[MBP Accounts])), filter(Implemented,Not(isblank('Implemented'[MBP Accounts]))))

Distinct Count Problem & various solutions
I think Joanne’s measure for Distinct count is excellent. It shows how easily we can calculate anything we want using Power Pivot.
But do you know we can modify it and use various other solutions as well?
In the below video, I have explained 3 different solutions and how they fare.
- Joanne’s original CALCULATE (… FILTER(…)) solution
- Improved CALCULATE(…) solution
- Using Excel 2013 regular pivot tables to calculate DISTINCT Counts
Watch the Distinct Count using Power Pivot & Pivot tables video [17 min]
Go ahead and watch this video. This is just a sample of what you get when you join our Power Pivot course.
Download Example workbooks:
Click below links to download example workbooks shown in this lesson:
Thank you Joanne
Thank you so much Joanne for sharing this example with us. It was fun learning from your example & exploring alternative solutions.
If you enjoyed this example, say thanks to Joanne.
Want to learn more? Join our Power Pivot Classes
If you would like to learn more about Power Pivot, then please consider joining my new course – Power Pivot online classes. The objective of this class is to make you a data analysis & dashboarding monster.
We are in enrollment stage now and we will be starting online classes from 18th of February. All classes will be pre-recorded so that you can watch them at your own time.
Click here to learn more & join us.

Hello Awesome...
My name is Chandoo. Thanks for dropping by. My mission is to make you awesome in Excel & your work. I live in Wellington, New Zealand. When I am not F9ing my formulas, I cycle, cook or play lego with my kids. Know more about me.
I hope you enjoyed this article. Visit Excel for Beginner or Advanced Excel pages to learn more or join my online video class to master Excel.
Thank you and see you around.
Related articles:
|
Leave a Reply
| « Formula Forensics No. 033 – Interpolation | Shading above or below a line in Excel charts [tutorial] » |


 At Chandoo.org, I have one goal, "to make you awesome in Excel & Power BI". I started this website in 2007 and today it has 1,000+ articles and tutorials on data analysis, visualization, reporting and automation using Excel and Power BI.

4 Responses to “Distinct Count & Blanks – Power Pivot Real Life Example”
Nice !!!
If you do the text to columns function (this way the pivot table treats the blanks as blanks), on the data and pivot it afterwords you get the right results. No need for the complex formulas
i think we're trying to find a way to leave the formula(ae) intact and not count blanks. the only way text-to-columns works is if you turn the offending cell(s) into text first, which defeats the purpose.
I spent AGES trying to get this to work! THANK YOU!!!!!!!!! BLYAAAAAAAAAAAAAT