Two weeks back I ran a poll asking you to tell me what is the last visible cell in your excel window. It was a casual poll. So I didnt expect a lot of responses. But, boy I was wrong! 295 of you have responded at last count. This is so much more than what I expected.
As I said, the purpose of this poll is to make a visualization out of the poll responses.
First let me show you the chart(s) I have prepared:

[click here for bigger version]
How to read this chart?
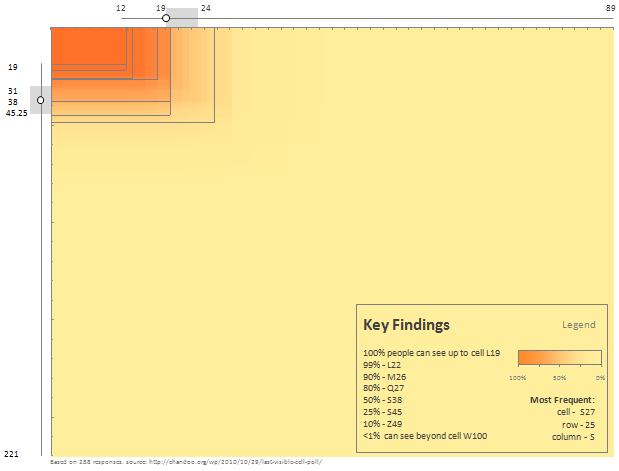
- The heat-map represents 221 rows & 89 columns worth of excel cells.
- Each cell is colored based on how much % of survey respondents could see it. The darker a cell is, more the people see it.
- The box plots at top and left show the distribution of visible columns & rows. For eg. the median columns visible is 19 and rows is 38.
- The grid lines show % of people who can see those cells progressively as indicated in the Key findings box.
- Source data: http://chandoo.org/wp/2010/10/29/last-visible-cell-poll/
- Chart inspiration: Browser Size by Google
What to do with this data?
If you publish excel files, you should fit as much as possible in to the range A1:M26.
How this chart is constructed?
- The heat-map is made with conditional formatting in Excel 2007. [video, tutorial, more..,]
- The Box plots are regular bar / column charts with extra series and a bit of formatting. Inspect the download file (link below) for details or get Jon’s box plot utility to make one.
- The legend is a regular column chart with gradient fill.
- The key findings is a text box with typed in text.
Key things to note about the data:
- Quite a few survey respondents mentioned more than one cell address in comments. I have considered only the first response.
- Many of you emailed me your cell addresses, but I did not consider that input as it was a tedious job going thru mails and extracting this information.
- I have removed one outlier where the cell address was something like A119. Rest all were fine.
Download the file with data & chart
Click here to download the file with survey data and charts [mirror here].
Feel free to play with the file to understand how it is constructed. You are welcome to play with the data and come up with alternative visualizations. Go ahead and dirty your hands…,
What do you think of this chart?
I have considered several options for visualizing this data. Finally, I took the inspiration from Google’s browser size and settled for the one you are seeing above. What do you think about it?
How would you have made this chart? Please share using comments.


30 Responses to “Great News: Chandoo becomes MVP”
Congratulations! It's well deserved. 🙂
This is amazing. Hearty congratulations and a rocking new year ahead!!!
Congrats! I have learnt alot from your site... and the most important is learning how to achieve the most with the simplest concepts.
Thanks for the excel calendar. Is it possible to get a simple big fonted calendar printable on an A4 size paper without any distracive notes or visuals? BTW, I have already signed up for your newsletter. With warm regards and
Gratefully yours
50+ year old CHarish.
Hey Chandoo,
Great to hear that. Congratulations! The best new year gift, I would say. Keep it up, u've been doing extraordinary work for the excel users community.
Regards,
Pankaj Verma
Congrats dude... fantastic news!
congratulations! your site is great, this is well deserved
Rich
I recently found your site, I visit many. The tips that you provide are in the top 1% of all the sites I visit. Keep on Excelling.
Arnold
South Africa
Congratulations, Chandoo! That's a great way to start the year and make the PHD even better.
Congratulations, Chandoo.
Your site is one of most useful on the net. Happy new year and lot of ideas you will present for us.
Congrats.
Just read your name in an email from Abhishek. Well deserved.
Congratulations, and Happy New Year.
Greetings from Rio de Janeiro my friend! You trully deserve it!
Nive way to start 2009! Keep up the good work!
FC
That was quite forseeable , so you have now really got your PhD in excel.
Anyways Chandoo you have made excel a real Fun doo
I will like you to write some more on INDEX and MATCH function in near future.
@Hey Chandoo ! Congrates....
Ab to treat mangta hai !
Well deserved Chandoo!!
Congrat's!! Very well deserved 🙂
i always browsed mr.excel and used to see MVP writtne below names of people who used to solve queries in excel forum there......i just used to admire as to what they have special in them that they are MVP......
but now i got my answer...............u deserve it man..........
@All: thanks everyone 🙂
Congratulations Chandoo, nice job!
Chandoo,
A well deserved recognition and a good start to the New Year. Continue your good work.
Subbu
Many Congratulations.
You deserve a Ph.D. 🙂
congrats.....
Congrats dude. Rock on!
[...] charting community in 2007 and has been growing strongly ever since. In year 2009, I have received the MVP award from Microsoft. Just few days back I have become a dad [...]
Respected sir,
I am impressed!.... Good job done.. Keep it up...
Sir, How to be a MVP certified person. What level of knowledge is required for it? send me links if possible.
Please reply...
Regards,
Dipak Khalasi.
Dipak -
The first thing you need to cultivate is the ability to search the web effectively. You could start by Googling "Microsoft MVP".
[...] boy and girl which has been made hectic and incredibly fun ever since to their life.He has been awarded MVP status in 2009 by Microsoft(and renewed in 2010,2011 & 2012).His MVP profile is here.If you want to contact him direct then [...]
Congrats Chandoo!!
[…] Chandoo becomes MVP […]