
Timeline charts are great for providing quick snapshots of historical events. And hardly a day goes by without some one making a cool visualization of a time line of this or that. Time lines are easy to read, present information in a logical manner and mostly fun.
So yesterday, I set out to mimic the iconic gadgets of all time in excel, just for fun. Then it strike me, why not make a visual time line of Microsoft Excel ? So I did that instead.
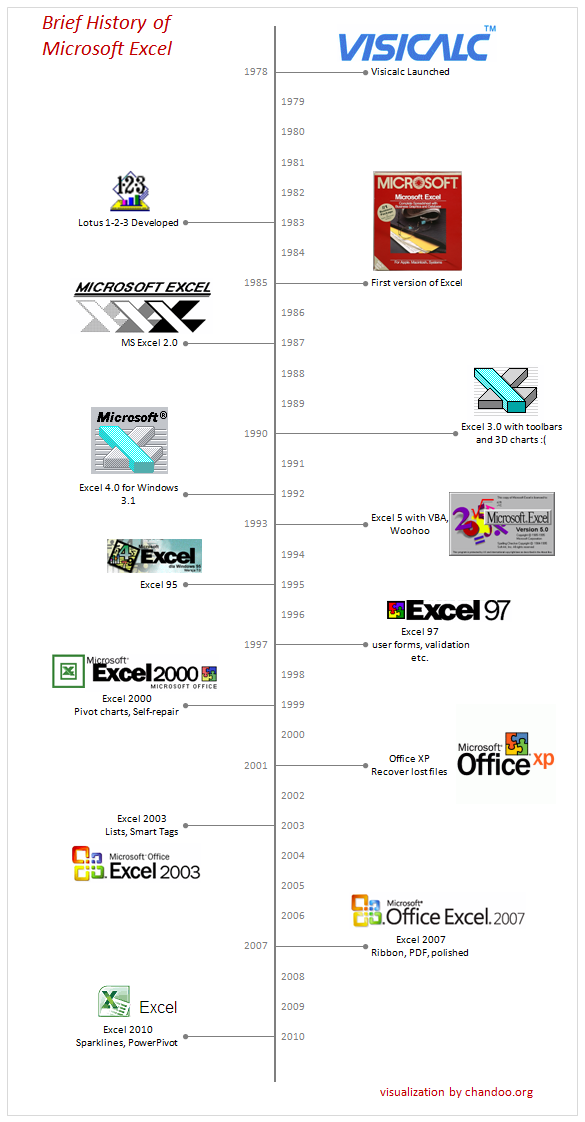
Here is a brief history of Microsoft Excel, in a visual time line
As you can guess, the chart is made in Excel. Read on if you want to know how this is constructed.
- The basic time line construction is similar to the one shown in project timeline chart article.
- What you are seeing is a bar chart with some formatting. The bars are made invisible.
- We use 100% negative vertical error bars to show the leader lines.
- Data labels show the messages like “VisiCalc launched”
- To show the years, I have used another dummy series and plotted it on secondary axis (related: how to add secondary axis?)
- Once the basic timeline is ready, I have added various images (logos) to the chart by pasting them inside the chart and manually adjusting their positions.
- Rest of the work is anybody’s guess.
- If you are curious to know how this works, download the source files [Excel 2003 version, Excel 2007 version]
It is hard to imagine that it has been only 25 years since this beautiful tool took birth and shaped in to such a massive productivity application.
Source of information on History of Excel and Logos:
- Various excel versions and their information [Spreadsheet Page]
- History of spreadsheets and VisiCalc [DSS Resouces]
- Excel for Mac – Press Kit [Microsoft Press Pass]
- Excel Splash Screens – Right from version 1.0 [Guidebook Gallery]
Your comments?
Do you like this visualization? How would you improve this? Also, if you are an excel veteran, share your memories and experiences…
More visualization projects:


22 Responses
You may want to include Microsoft’s first spreadsheet program, Multiplan, which was released in 1982 for CP/M computers and then ported to other operating systems. My first job after high school, in 1983, was German localization of Multiplan, and translation of the user manual. I have been using Microsoft spreadsheet software for 27 years, and I still learn new tricks from PHD!
I’m astonished to see this reminder that Lotus 1-2-3 began life in 1983, because I can clearly remember writing my first parameter driven costing model for some heavy-weight proposals around that time (if pressed I would have said earlier). They were quite complex and usually adopted by the accountants (I was just a business development guy) without too much cross-checking. The power of the spreadsheet was immense, and the same model survived until at least 1994 (by then in Excel).
Also missed is multiplan. Lotus was out for Macitoshes first as was Excel. Lotus was the first multi-dimensional GUI product (tabs). Excel came later and replace multiplan then became multi-dimensional with the availability of the Macintosh OS and its gui interface.
Nice job!
FWIW, that information at “computer literacy” was stolen from my site:
http://spreadsheetpage.com/index.php/resource/excel_version_history/
Office XP had Smart Tags and Task Panes
Office 2003 was Lists and XML
Also not very sure about this but the word VBA came only in 97 – till then the language was reffered to as Excel Basic
Not true, Sam. It was called VBA in Excel 5.
HISTORY OF MICROSOFT EXCEL
Microsoft originally marketed a spreadsheet program called Multiplan in 1982, which was very popular on CP/M systems, but on MS-DOS systems it lost popularity to Lotus 1-2-3.
@Gregor… Thanks for the pointer. I heard about Multiplan, but didnt include it as it was not really connected to visicalc-lotus 123-excel route. But I can add it to the download file.
My first brush with spreadsheets was in 1997, when I learned about lotus 123 (along with wordstar and dBase III). I wasnt keen on lotus 123 at that time as I found it pretty futile. Next time I used a spreadsheet program was excel in 2003 and by then I was writing programs to make spreadsheets from java and vb script to create reports…
@John: A well defined model stands the test of time and just works. I have defined an excel based qtrly reporting system way back in 2006 and last heard, folks are still using it. Spreadsheets have immense power to analyze, organize and process data without complicating it.
@John… I have replaced the link now. I saw your page too, but failed to realize the duplication. Thanks for the pointer.
@Sam.. my bad, I have used the info from web to make it, I have been using excel only since 2003, so I am not aware of some of the specifics of each version…. thanks.
I am a fan to excel an d I really appreciate the effort u put forth in making excel work. thanks
Excel 2013 and Office 365
When was the little paper clip helper first developed? Man, he was annoying JK.
Somewhere around 1989, I remember using LOTUS 1-2-3 and the company would by Excel until 2.0. I was SO thrilled to have an ‘UNDO’ key. In Lotus I didn’t have one. I had spent 6 hours updating our client list and meant to delete one row for a past client when I accidentally deleted the whole column of client names. With no ‘undo’ key at that time I had to start all over from a previous version. I learned a hard lesson that day. Say it with me…..SAVE OFTEN!
My very first experience with Excel was when it was running on DOS. This was just so time consuming and if you didn’t type the correct path, you were messed up. Happy to be using DOS masked behind windows.
after my dos days working with lotus 123 and word star and dbase then i started with windows excel has several powerful tools and i had also oworked with calc in unix environment on oracle db but to date i find programming in dbase is very easy o with general data fetching jobwith no too many???? after reading your blogs several of my doubts got cleared and int in excel grew ., thanks for your passion in excel
I first used the lotus 123 in the year 1997 with wordstar and dbase. that was awsome memories. Remembering al those who were part of that project.
My first contact with spreadsheets was with Multiplan, “introduced in 1982 as a competitor for VisiCalc.” as appear in Wikipedia. Then, my office began to use Lotus-123 and only later Excel. But in between, we found LUCID 3-D by DAC-EASY, an astonishing software that let us work in real 3D BEFORE that we could make that in Excel. Never know why Lucid didnt make the way to a star program. You can view tha ads for Lucid Version 2 in the pages of 1989 PC Magazine issues sold by $ 99,95. We are in Costa Rica, Central America, so we buy it through a friend who visit USA frequently.
I’ve updated the 2007 format file to include up to 2019:
https://1drv.ms/x/s!Am8lVyUzjKfph1LKBg_te-LhiwZj
Personally I prefer the vertical orientation in the article. The mouse scroll wheel is easier to work with than horizontal scroll. Simply changing the chart type does not work. The year axis labels are messed up.
Since you made the chart, did you learn a technique to keep the images in line. When I added the extra years, the chart scale changed and the images were no longer in the correct place. If found a tip that shows to use drag to position an image inside of a cell. I did that, but it did not show up in the chart.
I cannot download this file, it is giving some error.
Could you help please.