fbpx

Welcome to Chandoo.org.
My mission is to make you AWESOME in your work.

Hello, Namaste & Kia Ora. Welcome to Chandoo.org. 

My name is Chandoo. My mission is to make you awesome in Excel and Power BI.
I do this by sharing Excel & Power BI tutorials, examples, tips, videos and articles on this website. I live in Wellington, New Zealand with my beautiful wife Jo & our twins Nishanth & Nakshatra. Take a minute to browse various topics of the site to see how I can help you.

Thank you and welcome.

What is Power BI? what is power query and power pivot?
Power BI

What is Power BI, Power Query and Power Pivot?

In this installment of Power Mondays, let’s go the very basics of it all.

What is Power BI?

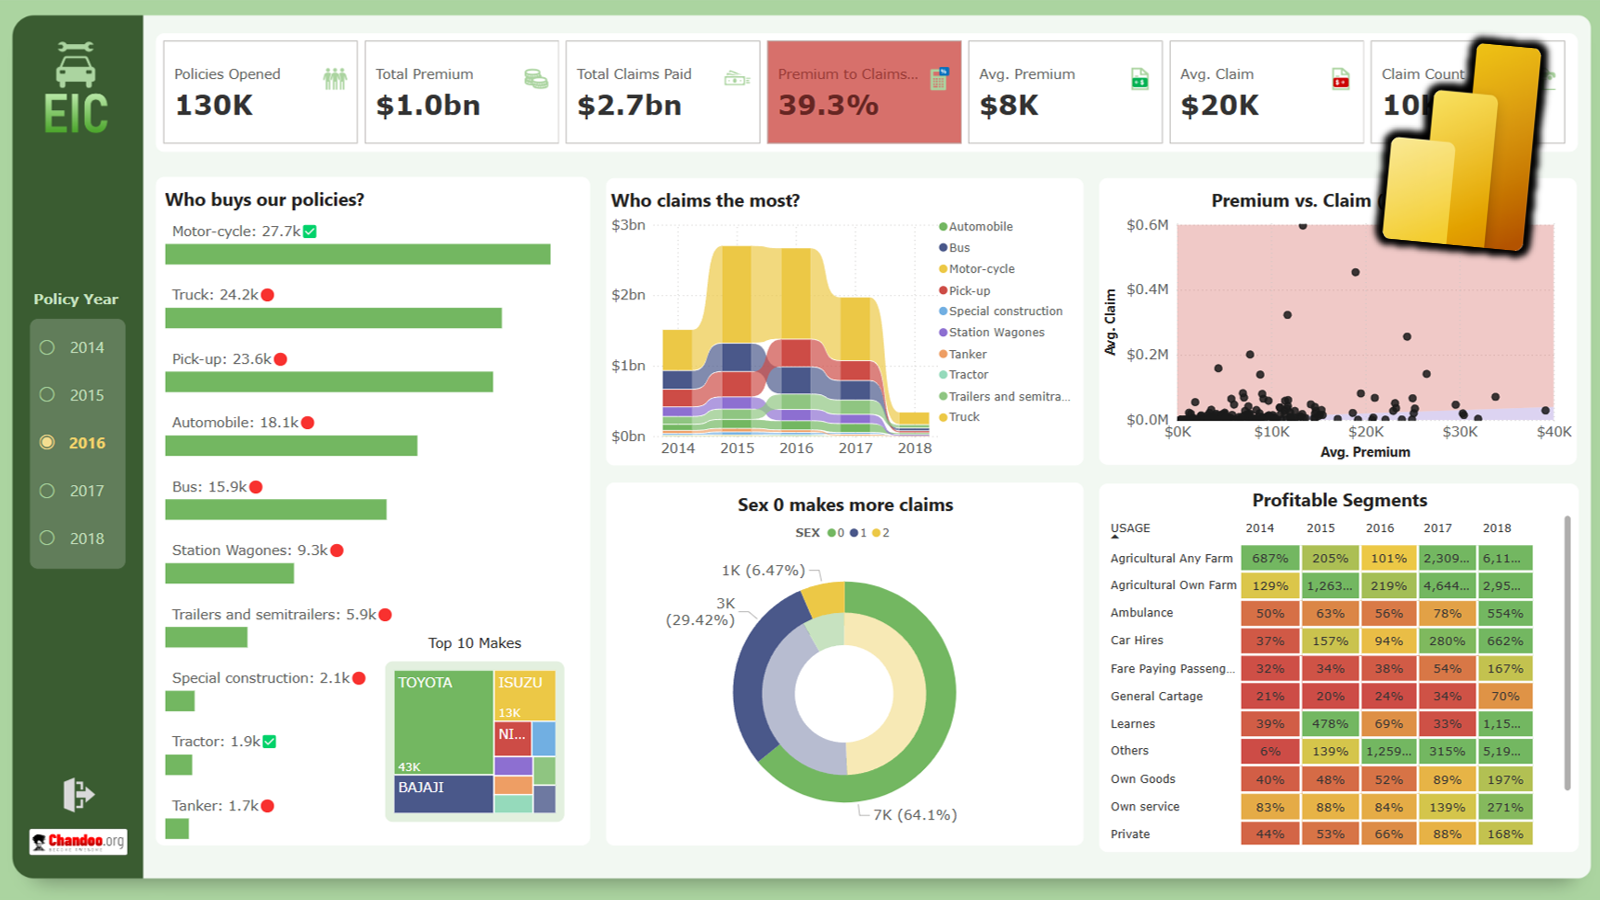
Power BI is a software to create and publish interactive, web-enabled reports & visualizations for your audience. You can use Power BI on a PC or web to create things. Once you publish a report (or few visuals), your audience can consume them by using any device – PCs, Macs, Web browsers, Apps on cell phone / tablets etc. 

Read This »
howto get random sample in power query
Power Query

How to get a random sample of data with Power Query

Today’s Power Monday trick is about Power Query. This is based on my experience of working with large volumes of data.

Today I have been building a hotel dashboard (more on this later). As part of the dashboard, I wanted to show a random sample of user reviews. Reviews database had quite a few rows, so I wanted to extract a randomized sample of 100 reviews and show them in the report. When you refresh the report (Data > Refresh), then a new set of reviews will be fetched and shown.

Let’s learn how to generate a random sample with Power Query in this article.

Read This »
hand-drawn charts in Excel - how to
Charts and Graphs

Make funky and creative hand-drawn chart in Excel – Quick tutorial

Charts are great way to tell story about what is going on in your business. But they also feel a bit too impersonal and meh. How about adding your personality to them? I don’t mean making them tall, dark and pretty. I mean using hand-drawing style to make them pop out. Something like above example of hand-drawn chart.

The best thing is, You don’t need to actually draw these charts by hand. We can use a powerful charting trick to get these charts automatically generated (and linked) to your data. Interested? Read on to learn how to create hand-drawn charts in Excel.

Read This »
top 5 with a twist - calculating above average sales
Power Pivot

Top 5 with above average – Power Pivot Trick

Welcome to Power Mondays. Every Monday, learn all about Power BI, Power Query & Power Pivot in full length examples, videos or tips. In this installment, learn how to get top 5 list with a twist.

Let’s say you are analyzing sales data and you want to know who are your top 5 sales persons?

Of course, this is simple, you just create a pivot to see total sales by person and then sort the pivot. First five rows have the answer you need. You can even apply a value filter > top 5 to show only their data.

Read This »
Excel Dashboard Training Course
Learn Excel

Announcing Excel School v2.0 – Quick intro and details inside

Do you want to learn Advanced Excel, data analysis, creative charting, dashboard reporting and be productive in Excel? Then you are going to love my Excel School v2.0.

This is the golden age of data. Any rewarding job or entrepreneurship requires good data literacy. We are all expected to understand the relevance of data, how to manage it, how to analyze it, visualize it and tell elegant stories.

This is where Excel School comes in.

Read This »
Learn Excel

12 Steps to learn Excel and become awesome @ work in 2018

Obviously, everywhere you look this week, you find advice on how to do better this year.

Well, you don’t have to wait for a new year to become awesome at your work, any day is new year for the rest of your life.

So, today I want to share 12 steps to learn Excel and becoming awesome. But first I have a secret to confess…,

I think becoming awesome in Excel useless.

What we really want is, to become awesome in our work. Since we spend a lot of time using Excel (and other office software), knowing how to use these better can have a huge impact on how we do our work.

In that spirit, lets look at 12 steps to learn Excel so you become awesome in your work.

Read This »
Power BI

Nest Egg Calculator using Power BI

Welcome to Power Mondays. Every Monday, learn all about Power BI, Power Query & Power Pivot in full length examples, videos or tips. In the first installment, let’s take a look at something we all can related to – Money. 

We all know that Power BI is good for creating awesome visual experiences. Today let me share another fun way to use Power BI – to build a calculator. Learn how to create nest egg calculator in this Power BI parameter example tutorial.

Read This »

Latest Video

for more videos…

Learn Excel Step by Step

Everything from Power Query to Dashboards, Shortcuts to Formulas, Pivots to Charts in one course.

Topics

Power BI

Excel & Power BI for you

What people say about Chandoo.org

A relative told me about your website since I need help creating pivot tables, I learned how to do it in a matter of minutes thanks to your tutorial. Where have you been all of my excel troubled life, I look forward to viewing your videos on youtube as well as on your site. You are going to make me EXCELLENT at Excel!
Soulful Sista
Excel Sister
Hi Chandoo, I just want to say I really appreciate your Excel tutorials and all your hard work that it took to compile the huge library of content. Your site has helped me gain a better understanding of Excel which has helped me in my job. You are helping the world!
Felix H
Accountant
Throughout my life as an administrative assistant; your site has been invaluable to me. And now that I’m a recruiter; it’s still an amazing resource for when I need to teach someone something quickly. You are a friggin’ Rock Star!!! Thank you for everything you do.
Jason S
Recruiter

Courses for you

training-calendar-view

Excel School

Learn how to work with data, make calculations, pivots, create amazing charts and powerful dashboards from scratch using Excel School + Dashboards program. Suitable for analysts, managers or professionals who need to use Excel often.

vba-classes-from-chandoo

VBA Classes

Use VBA to automate your tasks and build powerful spreadsheet based apps. In this course, learn all about how to program with VBA, how to use the language and object model to your advantage. Suitable for people who build a lot of things with Excel.

cg2018-games-viz-power-bi

Power BI

Power BI, the newest technology from Microsoft is a game changer. You can build rich, interactive and informative displays for your audience using Power BI. In this course, learn all about Power BI, Power Query and Power Pivot and how to combine them to achieve awesome results.

=XLOOKUP(chandoo, on_social_media)