
Two weeks back I ran a poll asking you to tell me what is the last visible cell in your excel window. It was a casual poll. So I didnt expect a lot of responses. But, boy I was wrong! 295 of you have responded at last count. This is so much more than what I expected.
As I said, the purpose of this poll is to make a visualization out of the poll responses.
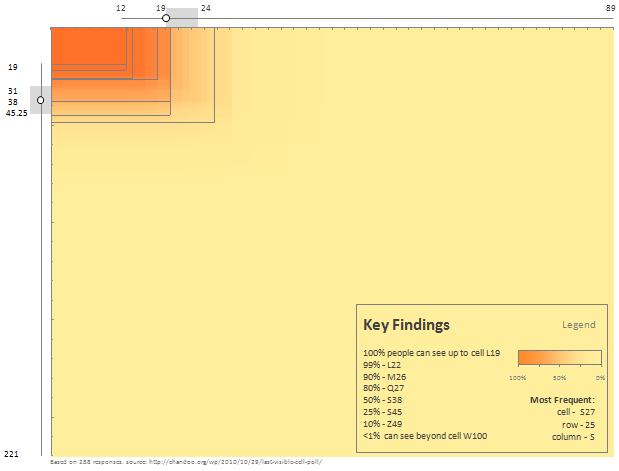
First let me show you the chart(s) I have prepared:
[click here for bigger version]
How to read this chart?
- The heat-map represents 221 rows & 89 columns worth of excel cells.
- Each cell is colored based on how much % of survey respondents could see it. The darker a cell is, more the people see it.
- The box plots at top and left show the distribution of visible columns & rows. For eg. the median columns visible is 19 and rows is 38.
- The grid lines show % of people who can see those cells progressively as indicated in the Key findings box.
- Source data: http://chandoo.org/wp/2010/10/29/last-visible-cell-poll/
- Chart inspiration: Browser Size by Google
What to do with this data?
If you publish excel files, you should fit as much as possible in to the range A1:M26.
How this chart is constructed?
- The heat-map is made with conditional formatting in Excel 2007. [video, tutorial, more..,]
- The Box plots are regular bar / column charts with extra series and a bit of formatting. Inspect the download file (link below) for details or get Jon’s box plot utility to make one.
- The legend is a regular column chart with gradient fill.
- The key findings is a text box with typed in text.
Key things to note about the data:
- Quite a few survey respondents mentioned more than one cell address in comments. I have considered only the first response.
- Many of you emailed me your cell addresses, but I did not consider that input as it was a tedious job going thru mails and extracting this information.
- I have removed one outlier where the cell address was something like A119. Rest all were fine.
Download the file with data & chart
Click here to download the file with survey data and charts [mirror here].
Feel free to play with the file to understand how it is constructed. You are welcome to play with the data and come up with alternative visualizations. Go ahead and dirty your hands…,
What do you think of this chart?
I have considered several options for visualizing this data. Finally, I took the inspiration from Google’s browser size and settled for the one you are seeing above. What do you think about it?
How would you have made this chart? Please share using comments.


11 Responses to “Fix Incorrect Percentages with this Paste-Special Trick”
I've just taught yesterday to a colleague of mine how to convert amounts in local currency into another by pasting special the ROE.
great thing to know !!!
Chandoo - this is such a great trick and helps save time. If you don't use this shortcut, you have to take can create a formula where =(ref cell /100), copy that all the way down, covert it to a percentage and then copy/paste values to the original column. This does it all much faster. Nice job!
I was just asking peers yesterday if anyone know if an easy way to do this, I've been editing each cell and adding a % manually vs setting the cell to Percentage for months and just finally reached my wits end. What perfect timing! Thanks, great tip!
If it's just appearance you care about, another alternative is to use this custom number format:
0"%"
By adding the percent sign in quotes, it gets treated as text and won't do what you warned about here: "You can not just format the cells to % format either, excel shows 23 as 2300% then."
Dear Jon S. You are the reason I love the internet. 3 year old comments making my life easier.
Thank you.
Here is a quicker protocol.
Enter 10000% into the extra cell, copy this cell, select the range you need to convert to percentages, and use paste special > divide. Since the Paste > All option is selected, it not only divides by 10000% (i.e. 100), it also applies the % format to the cells being pasted on.
@Martin: That is another very good use of Divide / Multiply operations.
@Tony, @Jody: Thank you 🙂
@Jon S: Good one...
@Jon... now why didnt I think of that.. Excellent
Thank You so much. it is really helped me.
Big help...Thanks
Thanks. That really saved me a lot of time!
Is Show Formulas is turned on in the Formula Ribbon, it will stay in decimal form until that is turned off. Drove me batty for an hour until I just figured it out.