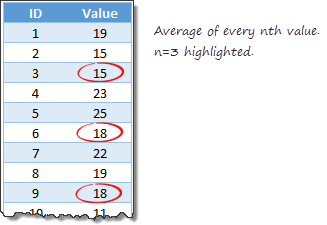
Lets say you have a large list of numbers, and you want to calculate the average of every nth value. Not the average of all numbers, but just every nth number.
That is what we will learn in next few minutes.
Few assumptions
Before we jump in to any formulas, first lets assume that all your data is in a table, conveniently named as tbl. Lets say this table has below structure.

Also, the value of n is a named cell N.
Average of every nth value
Approach 1: Using helper columns
 If you have no allergies towards nuts, dairy or helper columns, then this approach is easiest.
We just add an extra column to our tbl , called as helper.
In the helper column, write this formula.
=MOD([@ID], N)=0
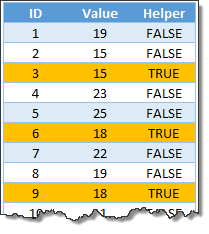
This will fill the helper column with TRUE & FALSE values, TRUE for all nth values, FALSE for everything else. See aside.
Once we have the helper column, calculating average of every nth value is easy as eating every slice of a cake.
We use AVERAGEIF to do this.
=AVERAGEIF(tbl[Value],tbl[Helper],TRUE)
Approach 2: Not using helper columns
Now things get interesting. Lets say you want to calculate average, but not use any helper columns.
First the formula:
=AVERAGE(IF(MOD(tbl[ID], N)=0,tbl[Value]))
Array entered.
Lets understand how it works:
We want the average of every nth item of tbl[Value] column.
In other words, we want average of every item of tbl[Value] column, whose corresponding tbl[ID] value is perfectly divisible by n.
How do we know when a value is perfectly divisible by another?
Don’t worry. You don’t have to do the long division on paper now. Instead we use Excel’s MOD function.
When a value is perfectly divisible by another, the reminder is zero.
So, MOD(value1, value2) = 0 means, value2 divides value1 perfectly.
That means…
We want the average of tbl[Value] when MOD(tbl[ID], N) = 0
Lets write that in Excel formula lingo.
=AVERAGE( IF(MOD(tbl[ID], N) = 0, tbl[Value]) )
This formula results in a bunch of values and FALSEs. Assuming N=3, this is what we get (for sample data):
=AVERAGE({FALSE;FALSE;15;FALSE;FALSE;18;FALSE;FALSE;18;FALSE;FALSE;15;FALSE;FALSE;14; …})
Since AVERAGE formula ignores any logical values, it will calculate the average of {15, 18, 18, 15, 14 … } and returns the answer you are expecting.
As this formula is processing arrays instead of single values, you need to array enter it (CTRL+SHIFT+Enter after typing the formula).
Bonus scenario: Average of FEBRUARY values only!
Here is a bonus scenario. Lets say you want to calculate the average sales of FEB alone… Then you can use AVERAGEIF (or AVERAGEIFS, if you want to have multiple conditions).
=AVERAGEIF(tbl[value], tbl[month], “FEB”)

Download example workbook:
Click here to download the example workbook. It contains all the techniques explained in this post. Play with the data & formulas to understand better.
Time for some challenges…
If you think averaging every nth value is not mean enough, try below challenges. Post your answers using comments.
- Write a formula to calculate average of every nth value, starting at row number ‘t’.
- Write a formula to calculate average of every nth value, assuming your table has only value column (no ID column).
Go ahead. Show off your formula skills. Post your answers in comments section.
Improving your Excel batting average
Calculating averages predates slice bread. Folklore says that when first neanderthal figured out how to express numbers and carved 2 of them on a cave wall, his manager walked by and asked “What is the average of these two? Eh?” and thumped her chest.
Although caves & wall carvings are replaced by cubicles & spreadsheets, we are still calculating averages, almost 2.9 million of them per hour.
So it pays to learn a few tricks about Excel Average formulas. Check out below to improve your average:
- Calculating Moving Average, Weighted Average
- Average of top 5 values
- Show averages & distribution in your charts
- Using SUMIFS formula (same tricks apply to AVERAGEIF, AVERAGEIFS too)
If your boss is the kind who thumps her chest and mocks you for your poor Excel skills, don’t cave in. Fight back. Enroll in Excel School and show that you can evolve.


13 Responses to “Convert fractional Excel time to hours & minutes [Quick tip]”
Hi Purna..
Again a great tip.. Its a great way to convert Fractional Time..
By the way.. Excel has two great and rarely used formula..
=DOLLARFR(7.8,60) and =DOLLARDE(7.48,60)
basically US Account person uses those to convert some currency denomination.. and we can use it to convert Year(i.e 3.11 Year = 3 year 11 month) and Week(6.5 week = 6 week 5 days), in the same manner...
This doesn't work for me. When applying the custom format of [h]:mm to 7.8 I get 187:12
Any ideas why?
@Jason
7.8 in Excel talk means 7.8 days
=7.8*24
=187.2 Hrs
=187 Hrs 12 Mins
If you follow Chandoo's instructions you will see that he divides the 7.8 by 24 to get it to a fraction of a day
Simple, assuming the fractional time is in cell A1,
Use below steps to convert it to hours & minutes:
1. In the target cell, write =A1/24
2. Select the target cell and press CTRL+1 to format it (you can also right click and select format cells)
3. Select Custom from “Number” tab and enter the code [h]:mm
4. Done!
Hi, sorry to point this out but Column C Header is misspelt 'Hours Palyed'
good one
So how do I go the other way and get hours and minutes to fractional time?
If you have 7.5 in cell A1,
- Use int(A1) to get the hours.
- Use mod(A1,1)*60 to get minutes.
If you have 7:30 (formatted as time) in A1
- Use hours(a1) to get hours
- Use minutes(a1) to get minutes.
I had the same issue. You can solve it by changing the format as described above:
Right click cell > Format Cells > (In Number tab) > Custom > Then enter the code [h]:mm
([hh]:mm and [hhh]:mm are nice too if you want to show leading zeros)
Thanks guys, these are the tips I'm looking for.
...dividing the number of minutes elapsed by the percent change is my task - "int" is the key this time
It doesnt work for greater than 24 hours
It returns 1:30 for 25.5 hours. It should have returned 25:30
Ideally I would right function as
=QUOTIENT(A1,1)&":"&MOD(A1,1)*60
Sorry, replied to wrong comment....
----
I had the same issue. You can solve it by changing the format as described above:
Right click cell > Format Cells > (In Number tab) > Custom > Then enter the code [h]:mm
([hh]:mm and [hhh]:mm are nice too if you want to show leading zeros)
Clever use of MOD here to extract the decimal part of a number. Divide a number containing a decimal by 1 and return the remainder. Humm. Very clever.
Thanks very much, extremely useful !